
Increasing Voter Turnout Is More Than Overcoming Apathy
Historically, the voter turnout rate in a midterm election has hovered around 40% of the eligible population. This often gets attributed to apathy among the non-voting population, but lately, there’s been more discussion about voter suppression and other impediments to voting. Countering these impediments is the goal of many get-out-the-vote campaigns. How can data help inform where these campaigns should focus their efforts (and change policies to encourage more voting)?
In 2016, nationally, we can see higher turnout in New England, the upper Midwest, and Northwestern states, while the Deep South and Appalachia struggle to get 50% of eligible voters to the polls.
Voter Registration
The first step to increasing voter turnout is making sure everyone is registered. So, where to begin? If a goal is to get more eligible voters registered (and informed of their registration status), it is key to understand where concentrations of non-registered, but eligible, voters are likely to live.
Least likely to be registered to vote include communities of color, those with low-incomes, and persons with disabilities. Individuals who do not speak English at home are increasingly identified as a population in need of voter-registration assistance. Least likely of all are young people under 30, half of whom reported not being registered to vote in the 2012 election. And each of these groups requires different types of outreach.
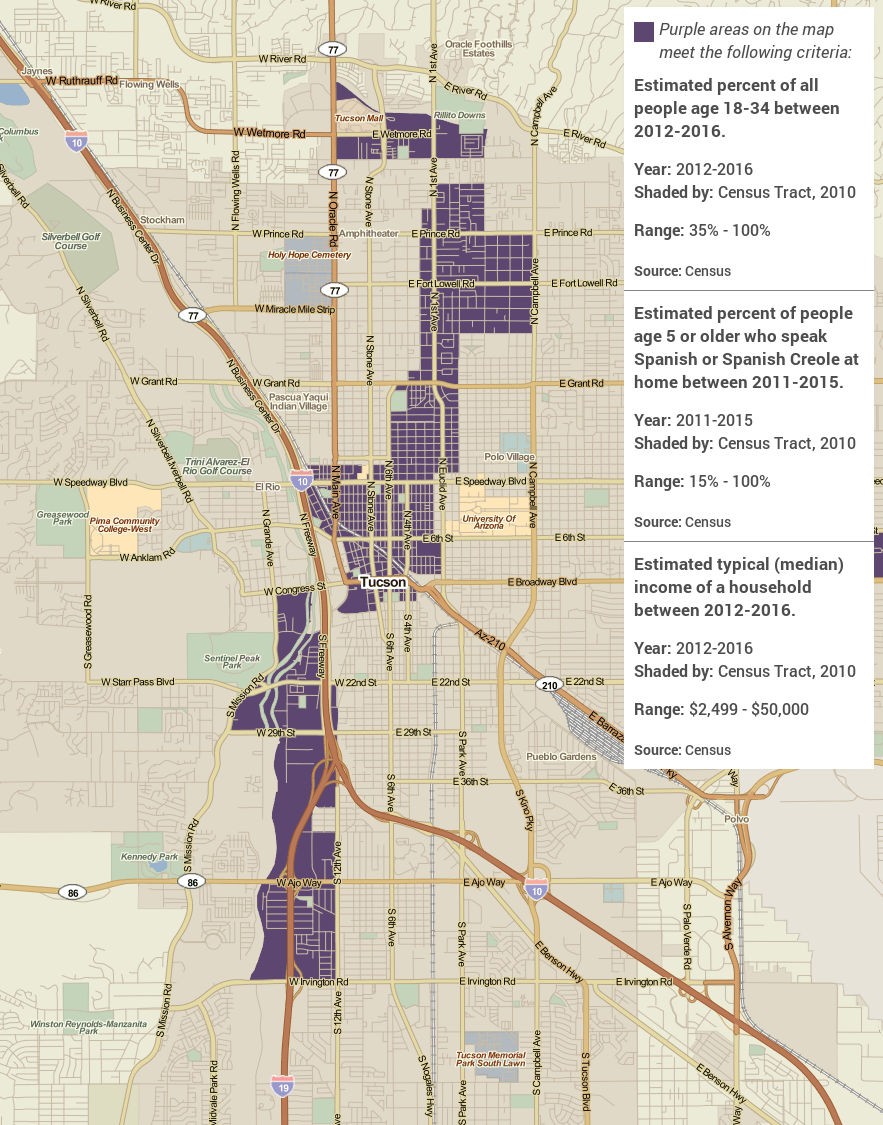
This 3-Layer Map shows where there is potential to have high concentrations of non-registered but eligible voters. By layering multiple criteria on the map, this tool can target areas most receptive to registration outreach. In this example of Tucson, Arizona, the purple areas represent block groups where more than 35% of the population is between 18-34, where at least 15% of the population speaks Spanish at home and English ‘less than very well’, and where median household income is less than $50,000 annually.
Turnout
Beyond challenges to registration, 14 percent of registered voters indicated in a 2016 Pew study that their reason for not showing up to the polls was being “too busy” or having “conflicting schedules”. An additional two percent cited inconvenient hours or locations of polling places.
Long lines can have a huge impact on who shows up to vote. People of color, young voters, and low-income Americans are disproportionately burdened by polling place closures and inflexible voting hours. Due to inconvenient locations and shortened hours on election day, both urban and rural African American voters are required, on average, to wait in line twice as long as white voters, while Latino voters report waits one and a half times those reported by whites.
Low-income populations and people of color are less likely to have flexible employment and childcare options that let them stand in line for an extended period of the workday. One study of the 2012 election estimated that long lines deterred at least 730,000 Americans from casting their vote that year.
As with many indicators of inequity, ease of reaching a polling place on election day follows racial and economic divides. Americans making under $15,000 each year, who may not have the disposable time to vote, are only half as likely to vote as those earning over $150,000 annually. Many eligible voters have more than one job on election day. On average, communities of color had fewer places to vote during the 2016 election. Others travel long commutes, or lack access to transportation that would allow for a trip from their workplace to the polls.
Any of these maps could be helpful in identifying populations that might have impediments to voting.
Percent of Families with Children:
Percent of Housing Units with No Vehicles Available:
Multiple-Job Holders:
Here in Philadelphia, we can see this concentration of neighborhoods where factors of inconvenience could most impact voter turnout. To make a case for more numerous polling locations or more flexible early voting policies, you could use PolicyMap’s 3-Layer Map tool to determine areas of most concentrated need. Knowing where these populations live, work, and vote can help when advocating for more responsive polling places, extended opening hours, and increased options for absentee and early voting.
Localized, data-driven efforts to build voter participation can have measurable and far reaching impact on election day. Studies have shown that residents contacted through informed outreach and in-person canvassing make it to the polls in higher numbers—in 2012, young people contacted by campaigners were 1.4 times more likely to vote, and in a four year period, Virginia saw a 114% increase in Latino voters at the pools after an effort toward canvassing in Latino and Spanish-speaking communities. Similarly, efforts to bring voters to the polls or to push for at-home voting options have been shown to raise overall participation by up to 5%, and participation for registered young voters by nearly 10%.
Get-out-the-vote campaigns are important, but can be all the more effective when understanding the targets of those campaigns. Find areas in your own communities where registration outreach could be most impactful, where there could be high demand for early voting and absentee voting, or where rides could be organized in your own communities.