
Joining Data to a List of Addresses
Say you have a list of addresses, maybe a set of properties under consideration for development, and you want to know what kind of neighborhood each of them is in. Or maybe you want to know which of them might be eligible for certain federal programs, like New Markets Tax Credits (NMTC) or Community Reinvestment Act (CRA) requirements.
In GIS-speak, this is a “spatial join”. You’re looking for the intersection of one geography (the addresses) and another geography (the census tracts, with underlying data). The concept is simple, but when using traditional GIS software, it’s a bit of a drag. You have to download and load the boundaries, and download, format, load, and join the tabular data, all before running the actual spatial join. It’s basic to advanced GIS users, but not to everyone else.
So, good news: This capability was added to PolicyMap last year with the new download feature. We haven’t written nearly enough about it. Before it was implemented, we’d been talking about it for so long, it became known internally as “the dream feature”.
Here’s how you’d do this in PolicyMap. It uses two features: the Data Loader and the Download feature. Basically, one step to upload, one step to download.
Data Loader
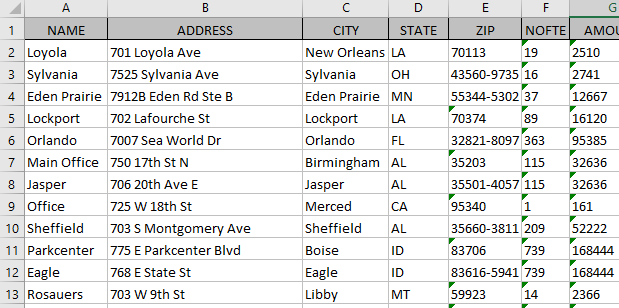
The first thing you’ll need is a list of addresses. Hopefully you have this in a spreadsheet or database somewhere. If you have additional data, like the name of the site or project cost, that can be included. If you happen to have latitude and longitude coordinates, include those too, it’ll save you some time. Save this list as a CSV file.
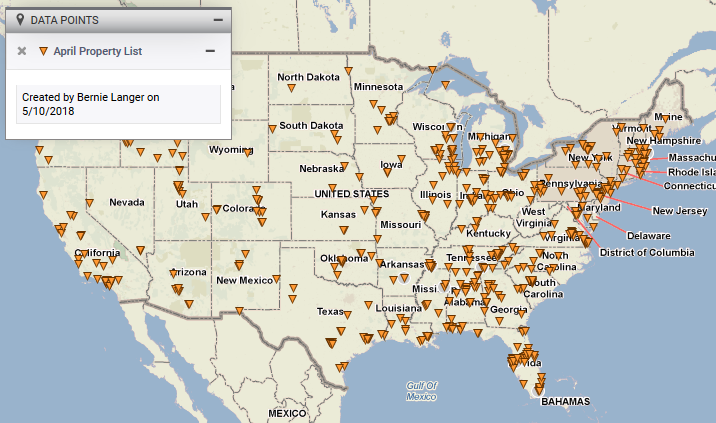
In PolicyMap, once you’re logged in, click on “Data Loader” at the top of the page. The Data Loader lets you upload your addresses. The process is fairly straightforward, but detailed instructions on can be found on our tutorial pages.
These points can than be seen on the Maps page. You’re halfway there.
Download
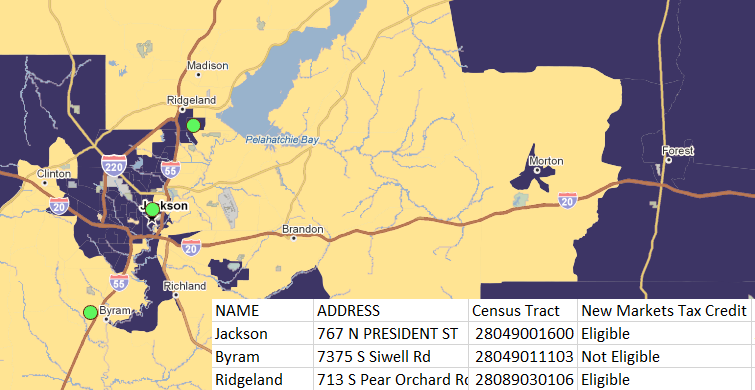
Before downloading data for the points, you have to choose the data you want to download. I’m going to choose NMTC eligible tracts from the Federal Guidelines menu.
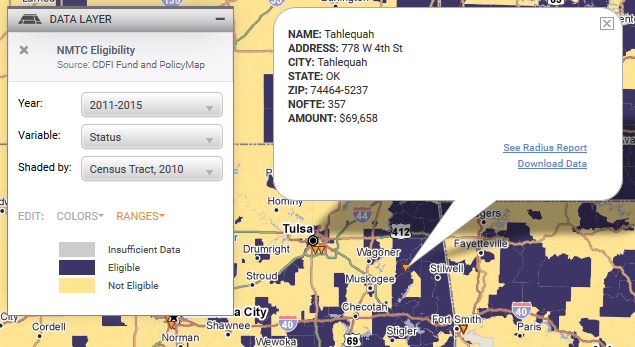
Visually, you can now see which points are in eligible areas.
![]() Now for the “dream feature”. Click on the download data icon on the top right corner.
Now for the “dream feature”. Click on the download data icon on the top right corner.
The Download feature lets you do a lot of things. You can download your layer data (the NMTC eligibility) by geography, like tract, and you can download your point data (that you just uploaded). But what you want to do is download the layer data for your points. For that, you’ll want the third option here:
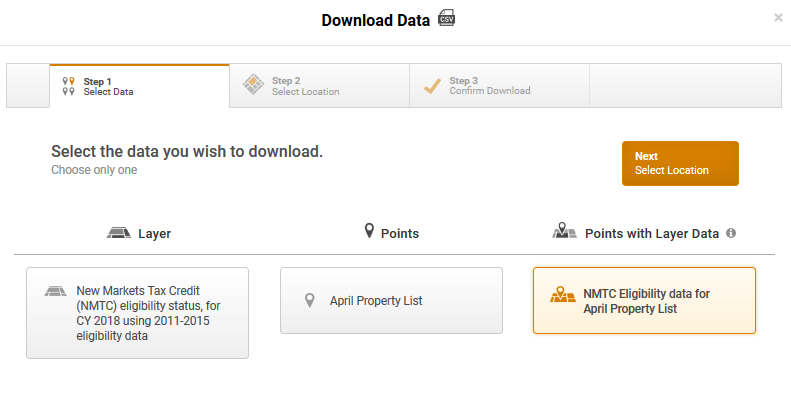
The next page asks what area you want data for. If the points you’ve loaded are across the country, just type “United States” as your location. For more details on data download, take a look at our tutorial.
PolicyMap will then e-mail you a CSV with all the points you uploaded, plus a column with the data value:
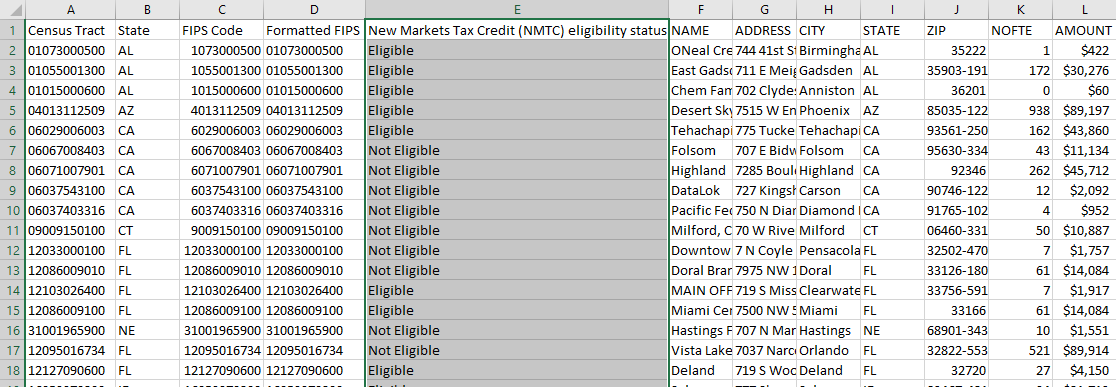
Voila! And keep in mind, you can do this with numerical data, so you could find, for example, the median income in the tract of each property.