
Finding Ethnic Enclaves through Language Data
Data
Language Spoken at Home
Source
Census: Decennial Census and American Community Survey (ACS)
Find on PolicyMap
- Demographics
- Language
- Speakers by Language
- Language
One of the big new data categories that came with the recent ACS update was language spoken at home. 78.95% of people in the country speak only English at home, but that leaves more than one in five people who speak a different language. As you might assume, Spanish is the second-most common language, at 13.05%. After that, data on over 40 other languages are made available by the Census, and all are now available on PolicyMap.
This data can be very useful when targeting services to non-English speaking populations who might be underserved for that reason. For these policy-related issues, it may be more useful to look at foreign-language speakers that don’t speak English proficiently . Both sets of data can be found in the Demographics menu, under “Language”.
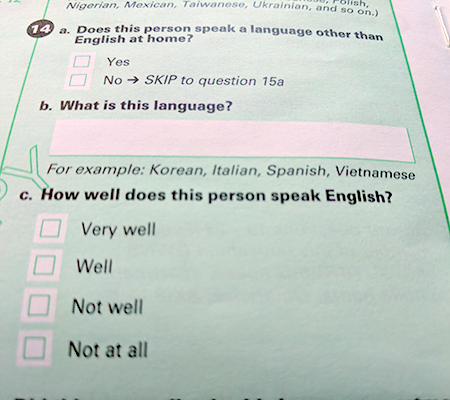
It can also be useful to look at this data to find historic neighborhoods with local flavor. Having this data allows you to see ethnic and immigrant enclaves. Last year, we posted about the challenges of mapping ethnic ancestry data, deciding in the end not to post it at all, due to inherent flaws in the data. This question is much more straightforward, asking first, “Does this person speak a language other than English at home?” and then asking for the language, rather than a quick summary of a family’s often-complicated bloodline. Of course, this results in significantly smaller numbers, and only accounts for non-English speaking ethnicities (so it’s not useful for finding, say, Irish immigrant communities).
But if we look at Italian-speaking people, we can see historic Italian neighborhoods like Boston’s North End, or South Philadelphia:
Looking at Yiddish speakers allows you to find Hasidic Jewish enclaves in and around New York:
Hindi-speaking communities around Edison and Metuchen, New Jersey:
Polish communities of Chicago:
Vietnamese-speakers in Portland:
The historically Greek neighborhood of Astoria in Queens, New York:
The Navajo-speaking population of the Four Corners area:
The Francophone population of the Louisiana Bayou:
The Brazilian and Cape Verdean Portugese-speaking communities of Rhode Island and southern Massachusetts:
You’ll notice that all of these embedded maps are using custom ranges. I set the darker values to show up for higher values than show by default. The default values, even for the darker colors, are very low; that’s because the colors are set by quantiles; the darkest purple are the areas with values in the highest fifth in the country. With these communities being small and few, quantiles don’t always work to set them apart, thus the custom ranges. You can read more about custom ranges on PolicyMap in our legend tutorial.
So you can see how you can use these maps to find areas where people speak individual languages. But wouldn’t it be neat to have a single map showing the predominant language spoken in a given area (or, alternatively, the predominant non-English language)? Stay tuned…
Let us know whether this data is useful to you, and how you’re using it!