
Lead Exposure Risk in Your Neighborhood

Data
Lead Exposure Risk Index
Source
Washington State Department of Health, Vox Media, and PolicyMap
Find on PolicyMap
- Health
- Risk Factors
- Lead Risk
- Risk Factors
[NOTE: The original blog post published by Eliza Wallace on 08/26/2019 was updated on 02/28/2023 by our Chief Data Officer Elizabeth Nash.]
Mitigating Lead Exposure and Disparities
The dangers of lead poisoning in children were brought to the fore by the drinking water contamination disaster in Flint, Michigan. U.S. Public Research Interest Group Education Fund recently released a report stating that, “Nearly a decade after the advent of the Flint water crisis, Michigan still has no law or regulation to stop lead contamination of schools’ drinking water.”
But lead contamination is a nationwide issue. According to the CDC, while drinking water is one source of lead contamination, other major sources include lead paint in older housing, and dust containing lead in soils.
To help concerned residents, public health officials, and local organizations identify neighborhoods that might be at a higher risk of exposure to lead, we added an up-to-date Lead Exposure Risk Index to show estimated exposure at the census tract level.
Many homeowners in neighborhoods with older housing stock are familiar with lead paint testing and abatement. Several states offer tax incentives that have been effective in making lead paint abatement more affordable to homeowners and landlords. In Baltimore, the Green & Healthy Homes Initiative (GHHI) is working to help families reduce environmental health risks in their homes, including risks from lead paint. The Lead Exposure Risk data can help organizations such as GHHI target their outreach.
Even in neighborhoods where significant lead remediation has taken place, lead contamination in soils can persist. If children play outside and get dirty, they can end up breathing in or consuming dust that contains lead. Similarly, people can end up with lead poisoning if urban gardeners don’t thoroughly wash off any soil clinging to their produce. Some plants, such as leafy greens, are even at risk of lead uptake, meaning that the plant matter itself may contain lead.
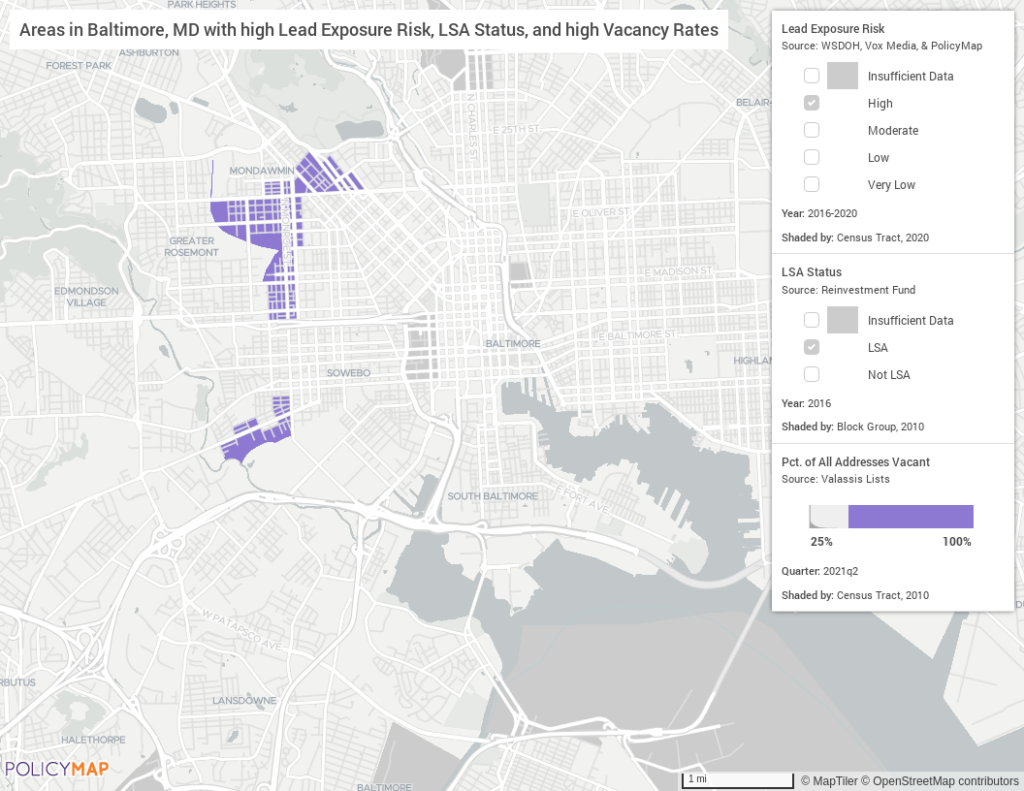
Neighborhoods with low access to healthy foods and high risk of lead exposure may be good candidates for programs that encourage raised bed urban gardening. The three layer map below identifies areas in Baltimore with the highest risk of lead exposure that are in a Limited Supermarket Access area, and that have high rates of vacant properties. Although some of these areas have nearby existing farms such as Bon Secours Community Works and Strength to Love 2, others could afford prime opportunities for expanding access to safe, healthy foods.
Lead Risk and Exposure Data
Lead Risk data has been updated on PolicyMap. The methodology was developed by researchers at the University of Washington and extended with Vox Media. We present a raw score of lead risk that is derived as a combination of the age of housing in a particular census tract, as well as the relative level of poverty in that location. This is based on the UW researchers who found these factors most associated with lead risk. A “high” risk indicates that a given census tract has a higher-than-average concentration of older homes, a higher-than average poverty rate, or both.
The estimates themselves are derived from ACS data, and presented as a raw score, a ranking on a 1-10 scale with 10 being the highest risk, and a categorical ranking (“Very Low” to “High”). The data can be used to visualize where there might be risk in lead exposure in communities; in the case of lead, prevention is critically important.
This data is available to all users, and can be accessed in the Housing menu, under Residential Buildings and Quality, or the Health menu, under Risk Factors.
Request More Information
Interested in learning more about our Lead Risk and Exposure Data? To talk to with a member PolicyMap team to learn how you can use PolicyMap to strategically plan home repairs in your community or develop prevention measures for high risk areas.