
Location Affordability Data on PolicyMap
I live five blocks away from the office. I walk to work every day, crossing four of Philadelphia’s tree-named streets (Spruce, Locust, Walnut, and Chestnut). Since I live downtown, people ask if my rent is very high. Well, my apartment isn’t cheap, but you can’t beat the commuting costs.
When looking at local costs of living, there’s long been plenty of data on rental prices in different areas (since it’s been a question on the Census and ACS). But commuting costs have been harder to find. HUD’s new Location Affordability index looks at the combined costs of housing and transportation, to try to get a true look at the cost of living in an area.
One thing the HUD data keeps in mind is that different kinds of households have different kinds of commuting costs. A dual-income family probably spends more on housing than a single worker. A retiree probably doesn’t spend much commuting. So the data comes in eight flavors, for eight different kinds of households, as laid out here:
|
Household Type |
Size of HH |
Income |
# Commuters |
| Regional Typical | Average Household Size for Region | Median Income for Region | Average number of Commuters per Household for Region |
| Regional Moderate | Average Household Size for Region | 80% of Median Income for Region | Average number of Commuters per Household for Region |
| Dual-Income Family | 4 | 150% of Median Income for Region | 2 |
| Low Income | 3 | 50% of Housing and Urban Development Area Median Family Income | 1 |
| Single Person Very Low Income | 1 | National Poverty Line | 1 |
| Single Professional | 1 | 200% of Per Capita Income for Region | 1 |
| Single Worker | 1 | Median Per Capita Income for Region | 1 |
| Retirees | 2 | 80% of Median Income for Region | 0 |
For each household type, you can find the calculated percentage of income spent on housing, on transportation, and on the combination, and you can find the varied costs for owners vs. renters.
This data, which is free to the public, is in the Incomes & Spending menu, under Additional Income & Spending Data, Location Affordability.
You can also find out more information from HUD at their site: http://locationaffordability.info/.
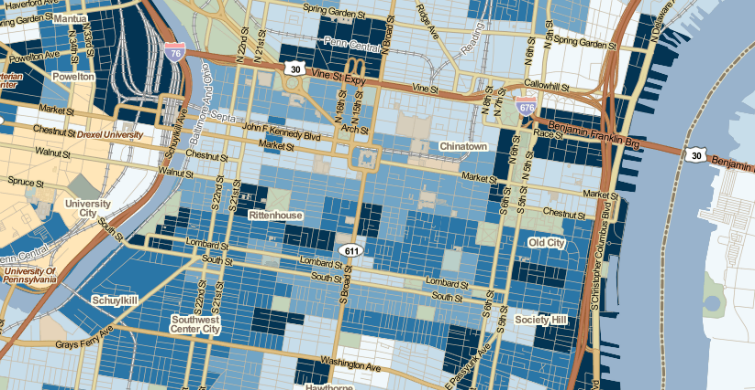
So how do I do with my walk to work? Of course, it depends how the weather is, but that’s not important right now. My rental costs are higher than average, though not extreme:
My transportation costs on the other hand, not bad at all:
That said, it’s very important to note that the data doesn’t take into account my higher-than-average footwear costs. I’ll be sure to let you know when that data is available.