
Looking for Patterns in Hearing Disability Data

Data
Hearing Difficulty
Source
Find on PolicyMap
- Demographics
- Population
- People with Disabilities
- By Disability Type
- Hearing Difficulty
The number of people with a hearing disability in the US has been growing over the last half century. Today around 20% of the population, about 48 million people, state that they experience some amount of hearing loss. There has been much discussion as to the contributors of this growing trend. Some of this increase may be due to the general aging of the population, but significant press has also been given to the growing prevalence of hearing loss among young adults. One hypothesized culprit for this problem in teenagers is the pervasive earbud headphones.
Since the 2010-2014 American Community Survey (ACS) data has gone live on PolicyMap, we have been able to look at the spatial and geographic patterns for a whole host of new indicators. The ACS estimates for people with a hearing disability give us the opportunity to look at the geographic distribution of a health problem that people don’t usually think about geographically.
At the state level, there are not overwhelmingly clear regional patterns. Outside of a cluster of higher rates of hearing loss in the Northwest, the states with the lowest and highest rates are scattered across the country.
Yet, at the county level a very different pattern is apparent. Using a cutoff at the highest range in the state level map (percent of the population with a hearing disability greater than or equal to 4.27%), an interesting spatial pattern may be present.
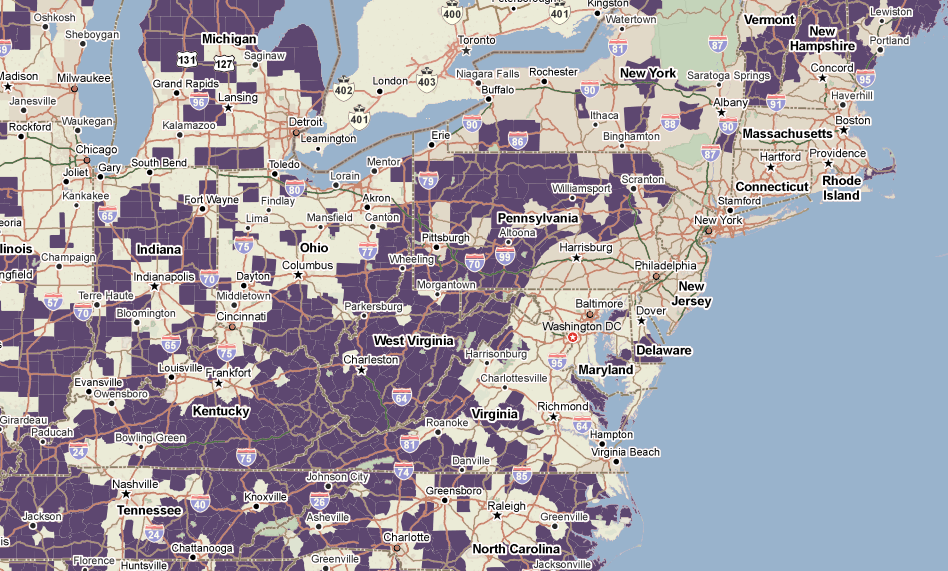
Looking at counties along the Acela Corridor, none of the urban areas between Washington, D.C. and Boston exhibit the highest rates of hearing disability. However counties with the most dramatic prevalence of this health problem crop up in far western Maryland, central Pennsylvania, and West Virginia – the more rural areas of the eastern seaboard.
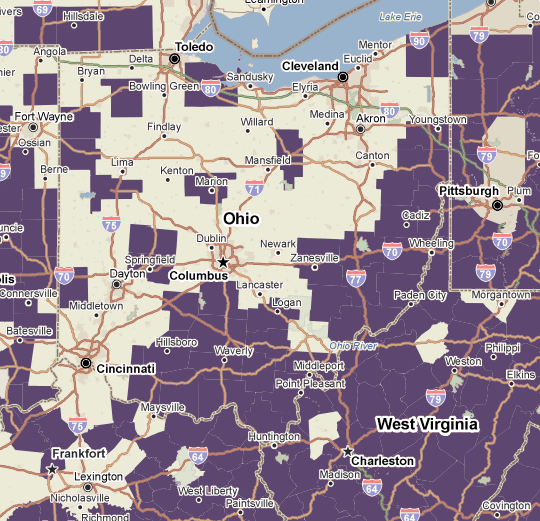
This urban-rural pattern is not unique to the East Coast. Turning to my home state of Ohio, none of the counties that surround the state’s three major cities – Cleveland, Columbus, and Cincinnati – exhibit the highest incidence rates of hearing disability, while many of the rural, southern counties do.
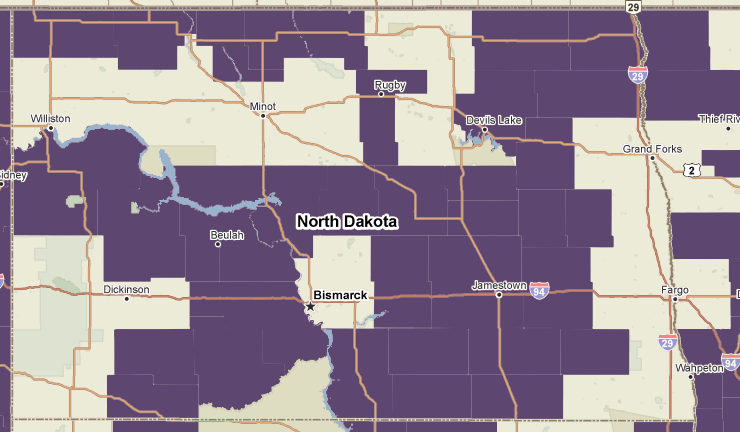
Even in North Dakota, the lower incidence rates appear to cluster in the counties that house, or are nearby, cities.
Given all the noise associated with urban areas is it possible that rural residents exhibit higher rates of hearing loss? At least in Australia, it appears that this is likely the case. Using a sample of respondents from the city of Perth, located on the isolated Western coast of Australia, and the surrounding rural areas, a team of researchers found that rural respondents were around two times as likely as urban respondents to have hearing loss. One possible rationale for this trend is that rural areas have less access to health care services, which inhibits early interventions that may stem hearing loss.
While by no means conclusive, this interesting spatial pattern shows a trend in hearing disability you might not have thought about before. Stay tuned for posts on the ACS data for sight disabilities and other new indicators available on the site.
Hearing disability data is available to all PolicyMap users. It’s in the Demographics menu, under “People with Disabilities.”