
Discover What’s New: Map Extent, Citation Generator, and Enhanced Data Loader

At PolicyMap, we’re driven by our mission to make geographic data easily accessible and understandable. And we’re always looking for ways to help our users gain even deeper insights through our application! We’re excited to share new features launched by our talented technology team: Map Extent capabilities, a Citation Generator, and an upgrade to our Data Loader (coming soon!).
Let’s dive into it!
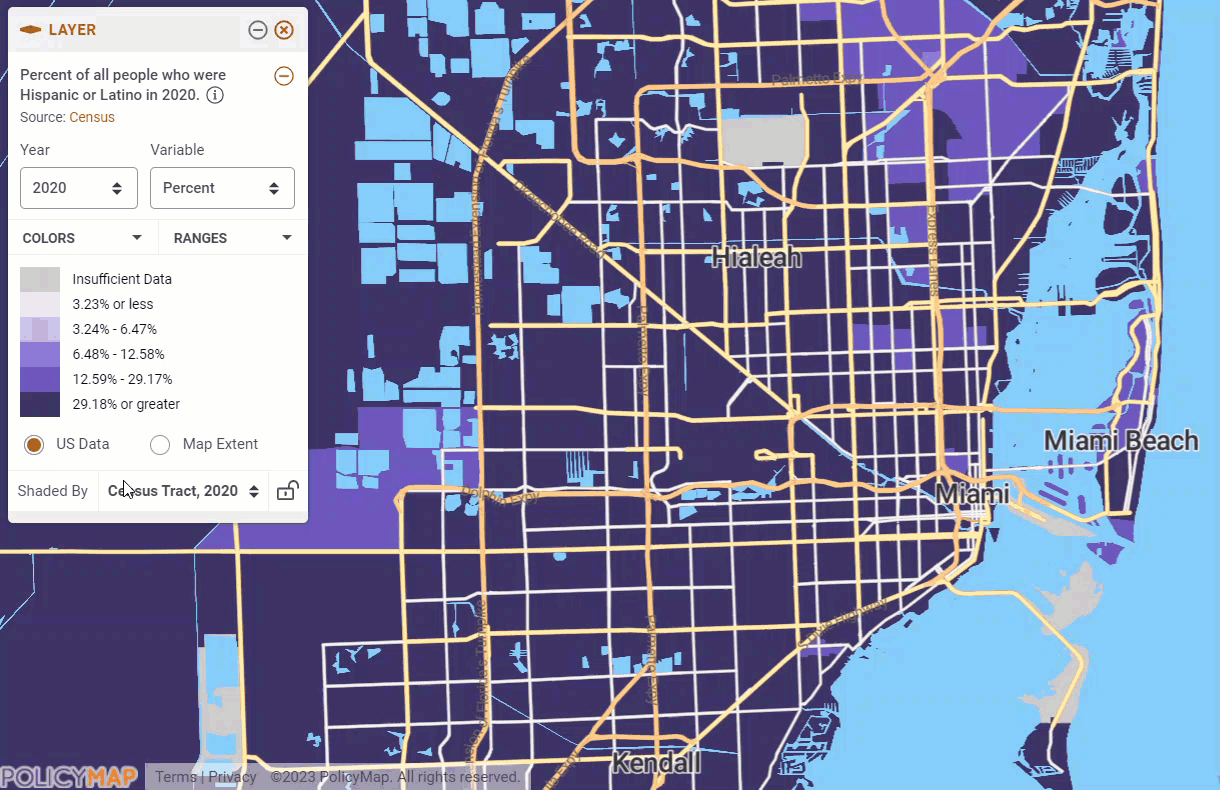
Focus Locally with Map Extent
We’ve added the ability for users to better understand data at a local level by limiting the range of data to the geographic area viewable on the screen (the map extent) or within a pre-determined geographic boundary. In our dynamic application, every time the displayed map changes by zooming or panning the map, a new map extent is created, and the data is refreshed. This feature is in addition to the default national range cut points used in PolicyMap.
To start, select a data layer. The map will, by default, provide cut points in the legend based on the range of data for the nation. Select the Map Extent radio button in the legend and the range will adjust based on the range in the current map window (the extent). This will also adjust your color ranges and the values they represent in the legend.
Subscribers can find more detailed information on the new Map Extent feature here. Have questions about how to use the Map Extent feature? Contact PolicyMap Support.
Save Time with our Citation Generator
We’ve launched a Citation Generator to support the hundreds of researchers, colleges, and universities that rely on PolicyMap, across many fields from public health to business, sociology, economics, urban studies, nursing, social work, architecture, and more.
Our Citation Generator is a fast, reliable way to cite PolicyMap as a source for your research, essays, presentations, and other projects. Simply create a map, click ‘Citing’ in the top right corner, and copy and paste the citation. Choose from APA, Chicago, MLA, or AMA Style.
With the punctuation, italicizing, and all the other citation details out of the way, you can save time and focus on visualizing and interpreting data.
Coming Soon: Dig Deeper with the Enhanced Data Loader
One of the most powerful features of PolicyMap is the ability to upload your own address-level data to view alongside our extensive catalog of place-based data—+75,000 indicators from over 150 public and private sources. We’ve recently made improvements to the Data Loader, increasing the file size capacity for our premium subscribers, and emphasizing ease of use.
The data loader allows users to load address-level data from a spreadsheet file to view in PolicyMap. We’ve updated the file capacity to 5,000 addresses for standard subscribers, and 10,000 addresses for premium subscribers. Have a larger dataset you need to upload? Learn more about our Analysis and Insights Services, and contact us.

With the increased file size, processing time naturally takes longer. We’ve added a notification feature that sends an alert when an upload is complete. This should make uploading point datasets and knowing when they are ready to use more straightforward.
Interested in learning more about the upload function? Attend one of our free online training sessions. If you have questions or need some additional help, please contact PolicyMap Support.
Features Request & Feedback
Have ideas for new features or data? Please share your ideas, we’re here to listen!