
Map the Meal Gap Data
Data
Food Insecurity Rate
Source
Find on PolicyMap
- Incomes & Spending
- Additional Income & Spending Data
- Food Insecurity
- Additional Income & Spending Data
There is updated data on PolicyMap! Feeding America’s Map the Meal Gap project has provided 2015 food insecurity data at the state and local level. The data contains information regarding child food insecurity rates, percentage of food insecure persons eligible for nutrition assistance programs, and the average cost per meal. Together, this describes hunger beyond the homeless and poverty stricken.
So, what is food insecurity? Map the Meal Gap is a part of the movement to change how people view and approach the issue of hunger in the US. Instead of concentrating on the physical effects of hunger, such as stunted growth and malnutrition, food insecurity focuses on missed meals and an individual’s likelihood of running out of food. As noted in National Geographic, hunger is becoming an issue based on income. With food prices rising faster than wages, employed people might not be able to buy a sufficient amount of food; 60% of food insecure individuals live in a household with at least one full-time worker.
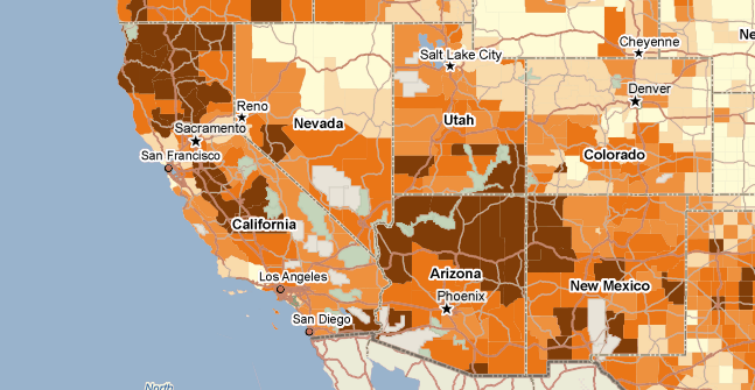
Below is a map of food insecurity rates. Looking at northern California, the overall food insecurity rate is higher than the rest of the state. Poverty rates are not particularly high in this area, which refutes the traditional view of hunger linked to poverty. The high food insecurity rates might be attributed to the high cost per meal in northern California, which is above the national average of $2.74 per meal.
It is difficult to identify a person who cannot afford to buy enough food for dinner or a family who cannot give their child lunch. Since is in not always visible, more awareness should be brought to the issue of food insecurity. The food insecurity data can be found under Income & Spending > Additional Income and Spending Data. Explore our new data and discover the trends of food insecurity across the nation.