
Mapping Meals on Wheels Eligible Populations

Data
Seniors (65+) Living in Poverty
Source
Find on PolicyMap
- Incomes and Spending
- People in Poverty
- By Age
The Trump Administration’s Budget Blueprint
The Trump administration released its budget blueprint for 2018 last week which proposed cuts to several agencies and well-known federal programs, including funding to sources that help to fund Meals on Wheels, the national nonprofit organization that provides nutritious meals and companionship to low income elderly Americans that are unable to shop for and prepare meals for themselves.
The direct impact to Meals on Wheels under the administration’s budget proposal is a bit murky, since Federal aid is only part of their funding, and the budget is a long way from its final form. But with all of the attention that the program has received in last several days, we wanted to take a look at some of the data available in PolicyMap to identify communities that might be affected by the proposed cuts.
Mapping Meals on Wheels Eligible Populations in PolicyMap
While eligibility for Meals on Wheels assistance depends on some individual circumstances, according to Meals on Wheels’ fact sheets, the program intends to serve senior citizens that are isolated or living alone, that are threatened by hunger and that are living in or near poverty.
With these general eligibility criteria in mind, we can use multiple data layers available in PolicyMap and the application’s 3-Layer Maps tool to drill down on those communities with an above average concentration of these vulnerable populations.
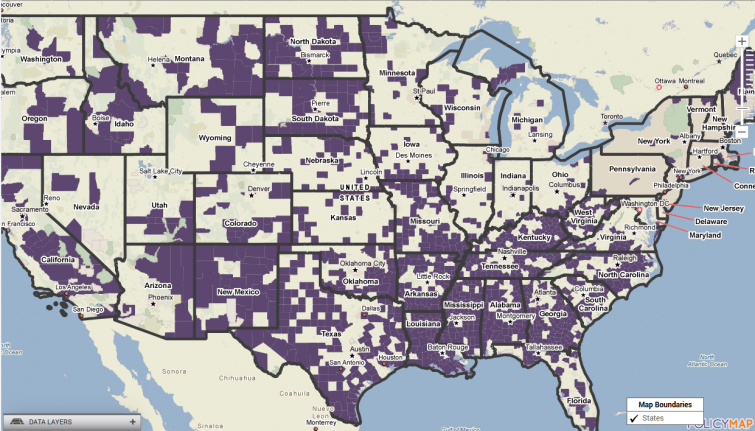
The first data layer we will add is the senior population living in poverty. This dataset can be found in the Incomes and Spending menu under People in Poverty > By Age. The national average for seniors (people 65 or older) living in poverty is 9.37% so we will set the minimum value in our range to 10% to show counties with an above average population of seniors living in poverty. The map below shows the counties that fit this criteria.
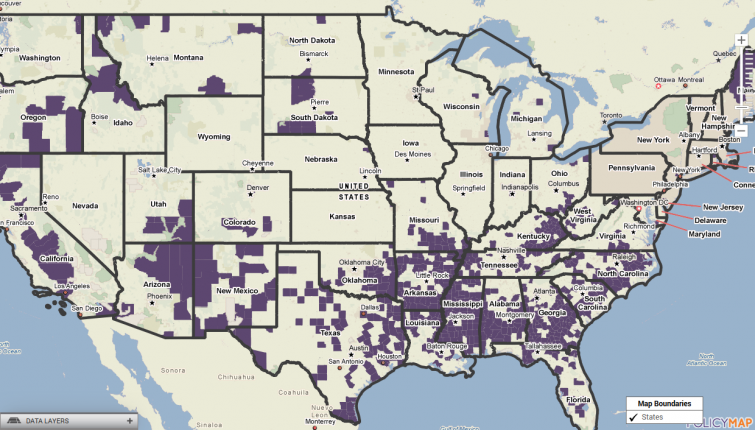
The second data layer we will add is the estimated food insecure population. This dataset can be found under Incomes and Spending > Additional Income and Spending Data > Food Insecurity. The average rate for the nation is approximately 15% so we can set a minimum value in our range of 16%. The map below shows counties that fit these first two criteria (above average rates of seniors in poverty AND food insecure populations).
The final data layer we will add to our map is the percentage of single person households (ie. households where occupants are living alone). This dataset is available in the Demographics menu under Household Size. The national average for this indicator is 27.64%, so we will set our minimum value to show counties with more than 28% single person households. The map below shows counties where all three of our criteria are met.
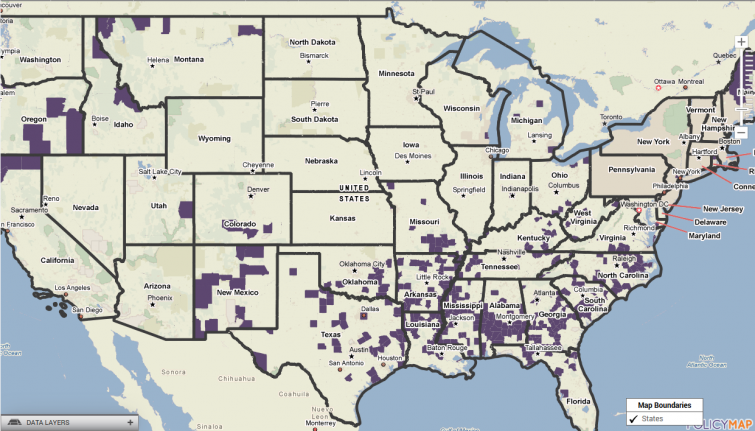
These are counties with above average concentrations of seniors living in poverty, food insecurity and persons living alone. These are the communities with a high proportion of individuals that the Meals on Wheels program assists with its efforts. As is evident in the final map, these counties are most heavily clustered in the southeast, but there are also counties that meet these three criteria in the southwest as well as remote areas of Oregon, Montana and Maine. There are a number of counties located in the most economically challenged regions of the country – Appalachia and the Mississippi Delta.
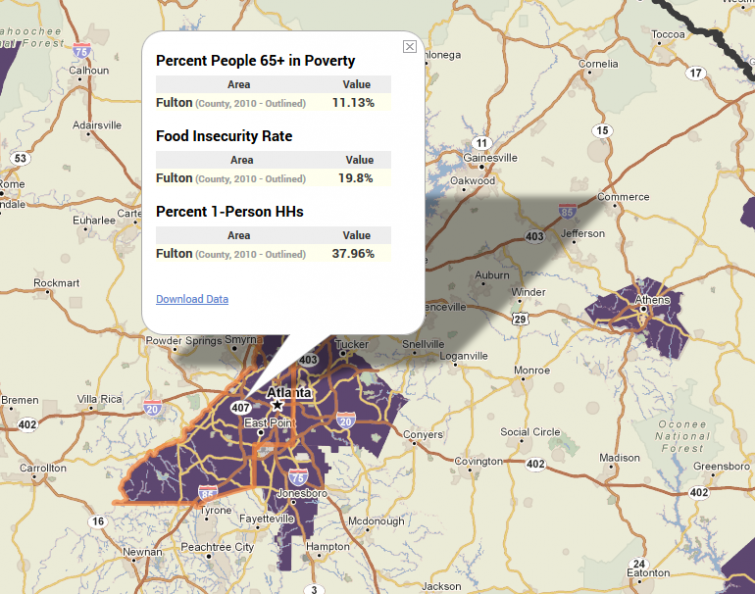
Interestingly, concentrations of these vulnerable populations can be observed in both urban and rural counties. The tri-county area around Atlanta (Clayton, Dekalb and Fulton Counties) is included in the final map. Other notable urban counties that meet these criteria include Dallas County, Texas; Shelby County, Tennessee (Memphis); and Milwaukee County, Wisconsin.
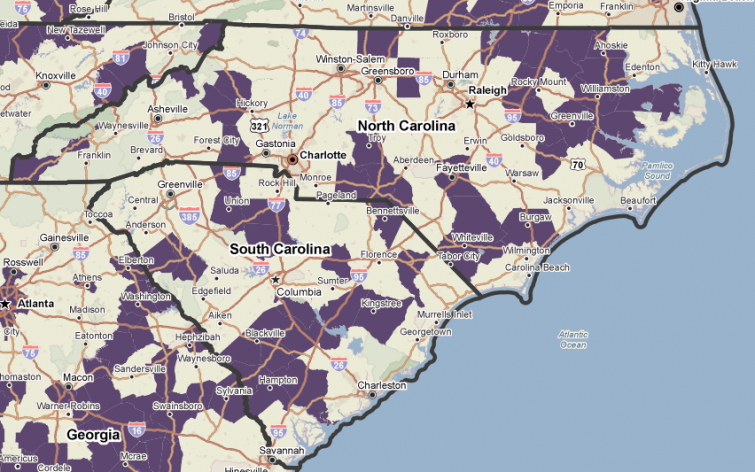
If we look closer at the Carolinas, we can clearly see the impact on rural counties. While major metropolitan regions (Charlotte, Raleigh-Durham, Columbia, Charleston) do not satisfy all of the criteria for identifying Meals on Wheels eligible populations, a number of counties in more rural parts of the states appear on the final map.
As we mentioned, the administration’s budget proposal serves simply as a blueprint and the federal budget for 2018 is a long way from its final form. As the budget continues to take shape, we’ll be on the lookout for more relevant data related to impacted programs and services.