
Mapping Single Parent Households
People often cite the economy and family values as key issues when weighing their vote in an election year. Though these two broad topics encompass any variety of specific concerns, they reflect the common goals and needs of people wanting to raise and support a stable family. While, over the course of the last 60 years, both the structure and stability of the American family have continued to change, we might consider how one’s familial and financial situation may be inherently linked together. In recent years, as the cost of higher-education has skyrocketed along with the cost of living for many low-middle class families, a cycle of struggle and financial strain has become all too common place. And with the added difficulty of raising children alone and on a single paycheck, the expanding income gap in this country seems to be placed disproportionately on the backs of single parent families.
In a recent New York Times article, a number of studies from the Brookings Institution, Harvard University and Child Trends are highlighted for their explanation of how the growing income gap may be attributed in part by the changing structure of the typical family unit. Evaluating the number of parents in a household as an indicator of financial stability and opportunity, the article suggests that changing marriage patterns could account for anywhere from 15-40% of growing income inequality across the country. These studies highlight a surge in births outside of marriage among less educated women, as a core component of single parent families that are continuing to fall to the lower end of the socio-economic range (with the percent of these births jumping from 10% to 30% in just the last 20 years; and the percent of 2-parent households dropping from 95% to 71% in the middle income-third since 1970).
Our data, here on PolicyMap, adds an additional dimension to this analysis, allowing us to present a spatial distribution of these changing marriage patterns and socio-economic demographics. This first map shows a distinct pattern spread across most of the southern East Coast and Gulf States of single female-headed households with children at a rate of close to 10% or more. These numbers at the county level illustrate an unmistakable picture of how common these “non-nuclear” families have become. Across the entire country, all 50 states have values 5% or more, with 4 states (across this southern belt) at 10% or more.
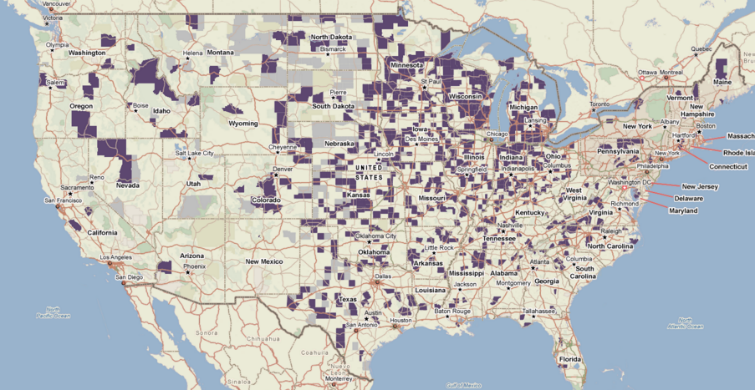
This second map presents a graphic of these changes over the course of the previous decade. Utilizing PolicyMap’s analytics tool, we’ve layered three datasets to show rates of 2-parent households paired with single mothers living in poverty, in areas of low educational attainment. This map reveals a clear picture of just what the NYTimes describes. In areas spread across the Midwest (which happens to be the area where Jessica Schairer lives, the single mother profiled in the article), where more than two-thirds of the population does not have a 4-year degree, and the percentage of married households with children has decreased by up to near 60%, a striking percentage of families living in poverty are increasingly single women with children – in this map, purple areas represent at least 50% percent change from 2000 to the period between 2005 and 2009.

Data Layer 1: Percent change in the number of married households with children between 2000 and 2010.
Data Layer 2: Estimated percent change in the number of families living in poverty that are headed by a single female householder with children between 2000 and the period of 2005-2009.
Data Layer 3: Estimated percent of people with at least a Bachelor’s degree between 2005-2009.
How might these trends help us better understand the changing faces of poverty and the various factors that contribute to strained financial and familial support systems? PolicyMap users can access this and related information to target areas where the income gap is growing the fastest. Check out our Demographics and Money & Income tabs to find these critical data.