
Nationwide Census Tract Comparisons on PolicyMap

Drive into any US town and you’ll see the famous population sign. Whether it’s a metropolitan city with a population in the millions or a small farming community populated with more animals than people, the numbers we see on those signs are merely a suggestion. Census boundaries change all the time — people move in and out of areas, businesses close or open, redevelopment takes place — and these changes make it nearly impossible to accurately compare a region over time. However, a lot of people depend on this information – politicians look at census tracts to better understand where their party is more or less represented, and federal agencies use census tracts to determine funding for numerous programs.
As we near the 2016 mid-term elections, more Americans are becoming aware of redistricting, for which Census data is key. Redistricting matters because the way maps are drawn can give one party a distinct advantage for an entire decade. That affects which party holds legislative majorities and sets the policy agenda.
Here at PolicyMap our job is to make it easy for people to get this information, so we took it upon ourselves to make it happen. We built translation tables for every census tract in the nation that gives the best description of how an area changed from 2000 to 2010 – and we made it available for FREE here on our website for everyone’s benefit.
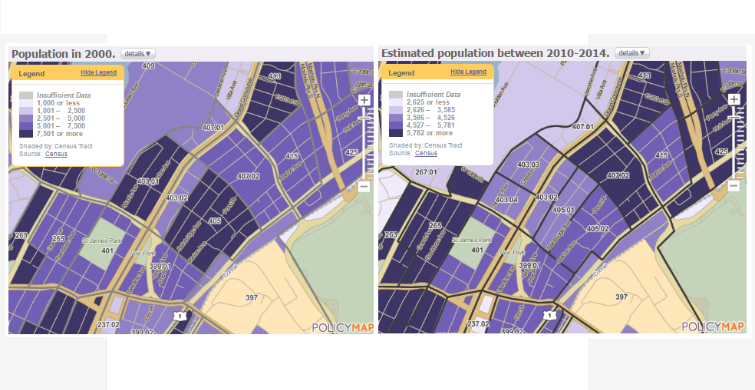
In this infographic, we applied our formula to look at the West Bronx, NY in 2000 and again in 2010 in order to get an accurate assessment of how its boundaries and population has changed. In doing this, we found that the population in the West Bronx changed from 559,362 to 822,604 in 10 years. We also found that across the entire United States, more than 22,000 U.S. census tract boundaries changed in that 10 year period from 2000 to 2010.
Do you want to see how your area changed? Log into PolicyMap, layer on Total Population in our Demographics menu, and toggle between 2000 and 2010 in the menu.
Fun fact:
Census Tracts were invented in 1910 and were only applied to a very few metropolitan areas. Their use has grown over time, and only with the 2000 census was every square inch of the United States put into census tracts.