
Neighborhood Level Health Estimates Give Deeper Insight Into Community Health

Data
Health Outcome Estimates and Risk Factor Estimates
Source
CDC BRFSS
Find on PolicyMap
- Health
- Health Conditions
- Chronic Conditions
- Health Conditions
During a global health pandemic, it’s more important than ever to have accurate information on local health conditions. Unfortunately, few public health datasets offer detailed health information, and most of those are only available for large geographies, such as states. For neighborhood health agencies and non-profits, these broader health metrics provide a useful benchmark but offer little information about their clients’ needs. To help fill this need, PolicyMap created Health Outcome and Risk Factor Estimates—small area health predictions focusing on current health conditions, behavioral risk factors, and preventative and health care access.
PolicyMap created these estimates using the Centers for Disease Control and Prevention (CDC) Behavioral Risk Factor Surveillance System (BRFSS) survey data and Census Bureau population estimates (using data from the ACS and decennial census). PolicyMap recently updated its health estimates to use 2017 and 2018 CDC BRFSS survey data.
Often those working in public health, community development, and other fields want to use data to look at trends in their neighborhoods. Unfortunately, the data needed to do this type of analysis often isn’t available at a local enough level. The small area estimates that PolicyMap has created allow users to see essential health measures like chronic health conditions, perceived health status, and preventative care at the neighborhood level. A great example of how this data can be used is when looking at chronic conditions like asthma.
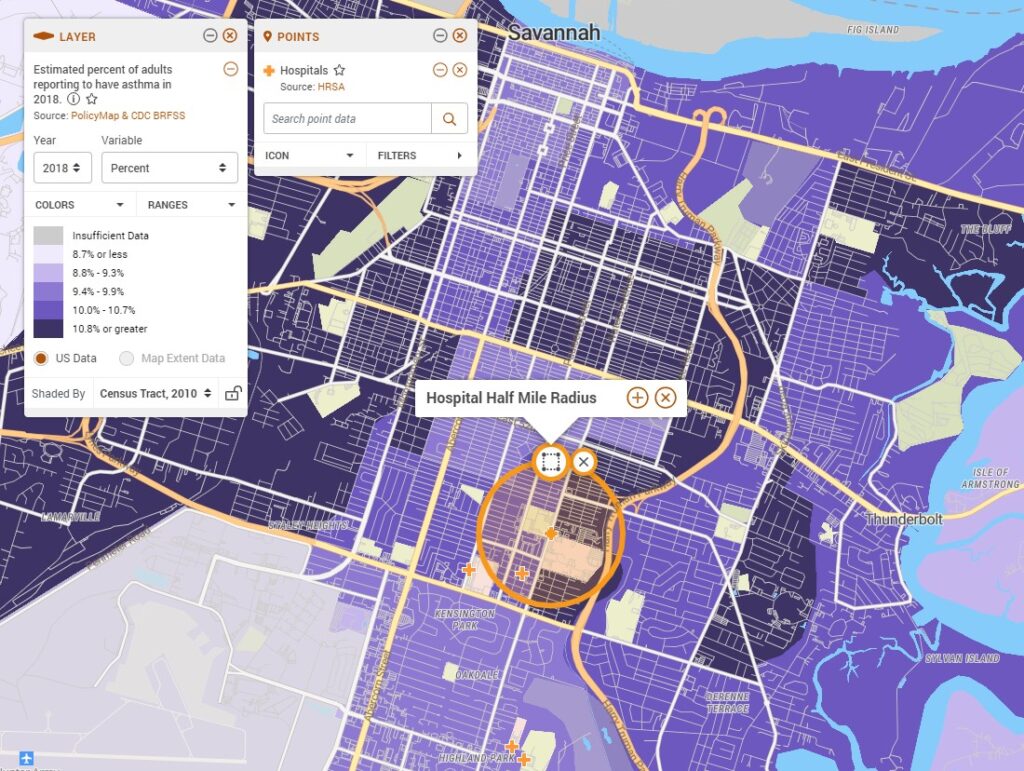
In a smaller city like Savannah, GA (est. population 144,000 as of July 1, 2019), we can look at trends in adults reporting to have asthma by Census Tract, a much smaller geography than possible with just county or city level data. Overlaying hospital locations on this map allows us to see the relationship between adults with asthma and hospital locations in their communities. Adding a half-mile radius around one of the hospitals allows us to go a step further and look at the concentration of adults with asthma in the immediate vicinity of this hospital. This granularity of data is more useful to a public health researcher or non-profit in a specific community looking to analyze trends in their service area.
Small area estimates are also beneficial when exploring access to medical care. According to Healthy People 2020, access to affordable and high-quality medical care is vital to staying healthy, and any barriers to receiving that care, like high cost or lack of insurance, can lead to medical problems that worsen health disparities, especially in already overburdened communities.
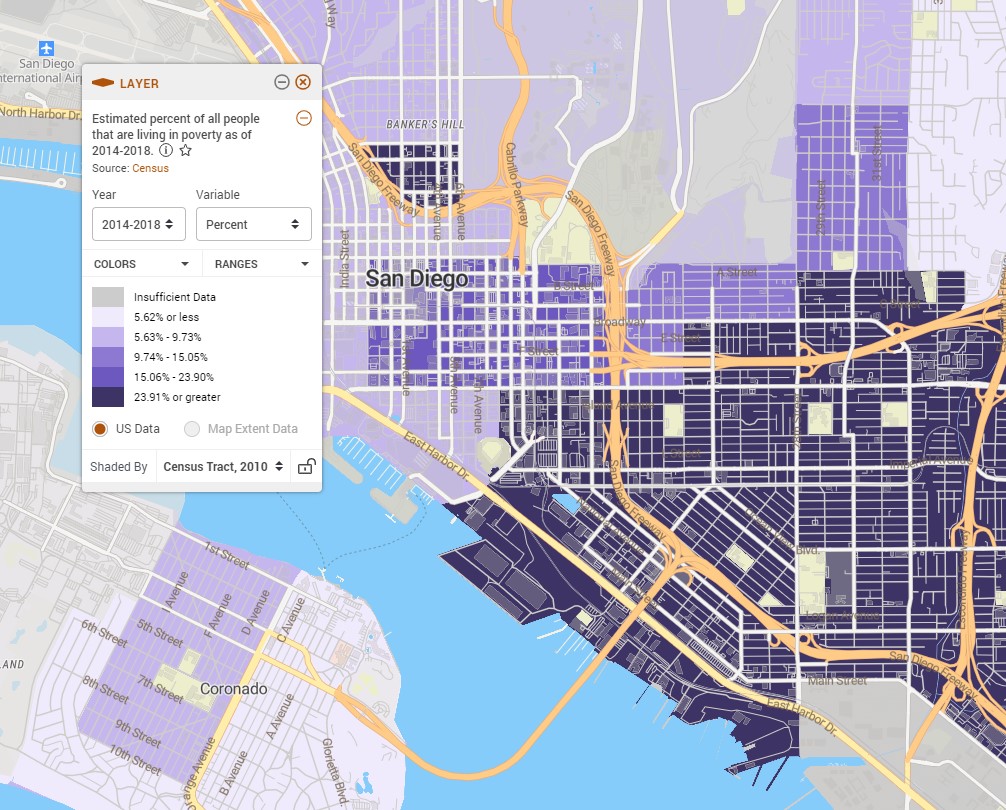
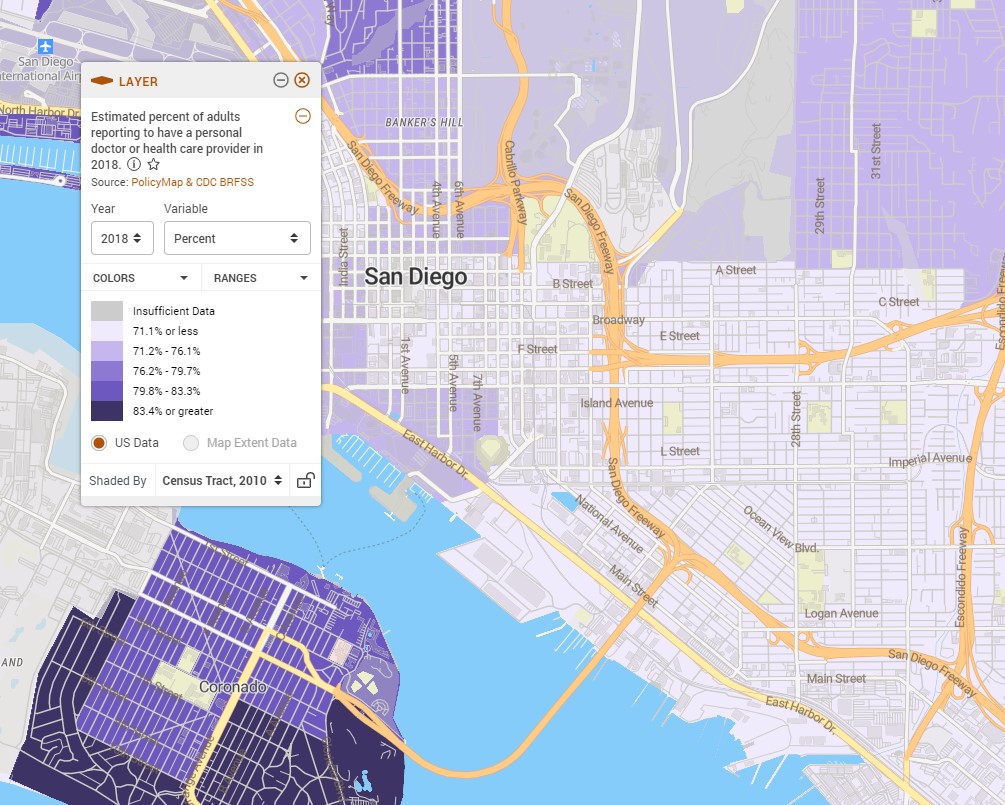
Looking at the Downtown San Diego area, we can see that areas with higher levels of poverty (the dark purple areas in the first map) are also generally the areas with the fewest adults reporting to have a personal doctor or health care provider (the light purple areas in the second map).
About the Data
PolicyMap’s Health Outcome and Risk Factor Estimates are available for:
- States
- Counties
- ZCTAs
- Census Tracts
The following indicators are available:
- Arthritis
- Asthma
- COPD
- Depression
- Diabetes
- Heart Disease
- Heart Disease or Heart Attack
- High Cholesterol
- High Blood Pressure
- Stroke
- Immunization
- HIV Testing
- Fair or Poor Self-Assessed Health
- Very Good or Excellent Self-Assessed Health
- Poor Mental Health Days
- Poor Physical Health Days
- Alcohol and Tobacco Use
- Overweight and Obesity
- Food and Exercise
- Primary Care Doctor
- Routine Checkup
Some indicators are only available every other year, because not all questions in the BRFSS questionnaire are asked each year. The BRFSS Questionnaire is comprised of three parts: the core component, optional modules and state-added questions. The core component section is further broken down into three sections: the fixed core, rotating core, and emerging core. The fixed core is comprised of questions that are asked every year by all states, while the rotating core is made of two distinct sets of questions that are asked in alternating years by all states. The emerging core is a small set of no more than five questions that can be added to the questionnaire to address emerging public health issues.
PolicyMap’s health prediction data is created through a small area estimation process, where tract-level data is estimated by combining survey data from a larger region with demographic data from census tracts. The small area estimation technique employed a multi-level regression and poststratification (MRP) approach that used population demographic and socioeconomic data to estimate local survey responses. This methodology is similar to that used for the CDC and Robert Wood Johnson Foundation’s 500 Cities project.
While this method provides good estimates of the kinds of health issues facing a neighborhood based on the population’s characteristics, take caution when using this data to examine the impact of specific local health policies or to track disease hotspots. Similarly, because demographic information is part of the estimation process, this data should not be used to create estimates of the demographic impact of health data.
Small area estimates health prediction data are available to PolicyMap subscribers under the Health menu.