
New Economic Mobility Data Up on PolicyMap
Summary: A timely new dataset about economic mobility is now up on PolicyMap. Using recently released data provided by researchers with the Equality of Opportunity project, users can see the percent chance that children from low- and middle-income families will achieve certain income ranges as adults.
With the passing of the 50th anniversary of Dr. Martin Luther King’s “I Have a Dream” speech and the March on Washington for Jobs and Freedom, economic justice is a topic of conversation around the country. Increasing attention has been paid to the effect that one’s geographic location has on one’s chances of being upwardly mobile, and how place intersects with racial and economic segregation. How does whether you grow up in Riverton, WY, Quincy, IL, or Atlanta, GA influence your chances of achieving a higher income than your parents did?
A recent study done by top academic economists Raj Chetty and Nathaniel Hendren at Harvard University and Patrick Kline and Emmanuel Saez at the University of California Berkeley addresses this question in what many are calling the most detailed study of economic mobility in the United States. The research examines spatial variation in economic mobility and takes a deeper look at the effects of tax expenditures on mobility as well.
We found this study to be so compelling that we were inspired to display a subset of the researchers’ data on PolicyMap! Towards the bottom of the Money & Income tab, you will now see a section called Economic Mobility, which provides a number of indicators showing the probability that children growing up in low- and middle-income families will achieve certain income ranges as adults.
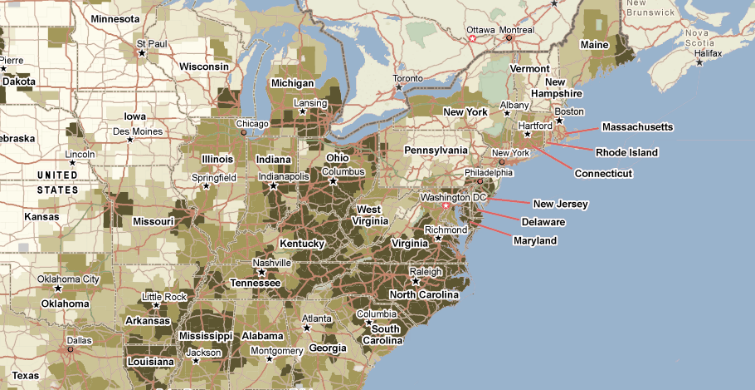
The way we chose to display the data on PolicyMap allows users to spatially see variation in economic mobility based on where one grows up. For example, the map below makes it easy to identify areas with a lack of economic mobility; it shows the percent chance that children who grow up in the lowest economic bracket (with parents’ household income below $25,200) will have household income in the lowest income bracket as adults. A quick glance makes it clear that children growing up in many places in the Southeastern U.S. still face significant obstacles in getting out of deep poverty.
The researchers’ analysis was done at the Commuting Zone level, a geography that is similar to Metropolitan Statistical Areas (or CBSAs) but covers rural areas as well. The data on PolicyMap is displayed by Commuting Zone, of which there are nearly 750 in the country.
In addition to seeing where there is a lack of mobility, you can also select indicators showing the likelihood of economic mobility by seeing where children from low-income families are making it to the middle-class or beyond. Below is a map showing the percent chance that children from low-income families will make it to the highest economic bracket as adults (defined by the researchers as an annual income greater than $99,600). You can quickly see that several rural areas in the Midwest offer the greatest opportunities for mobility; in terms of major metropolitan areas, Salt Lake City, UT, San Jose, CA, and San Francisco, CA rank highest in this regard.
Similar indicators from the study are also available for children growing up in middle income households. We hope you enjoy this new dataset. As always, don’t hesitate to email pmap@policymap.com and let us know if you have any questions or comments!