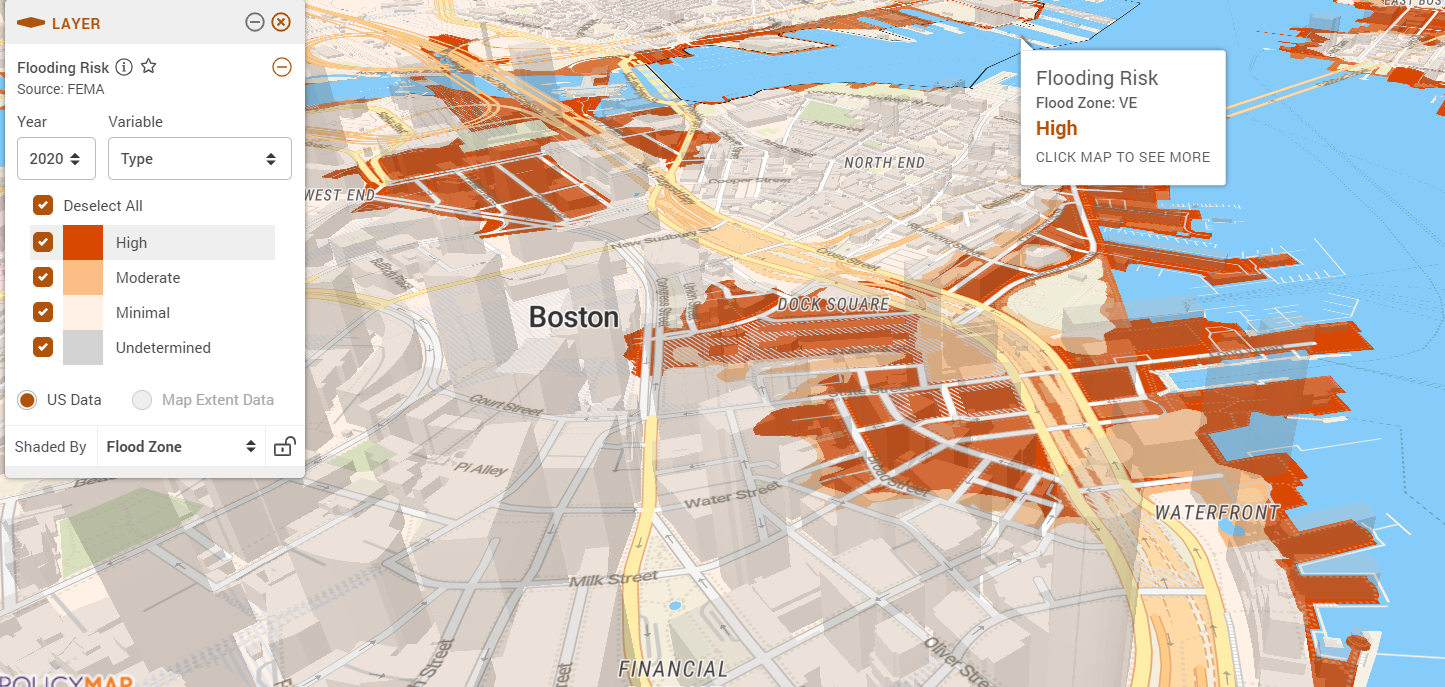
Visualize geographic data with new contemporary, customizable base maps, additional zoom levels and 3D views.
Analyze Data with Better Tools
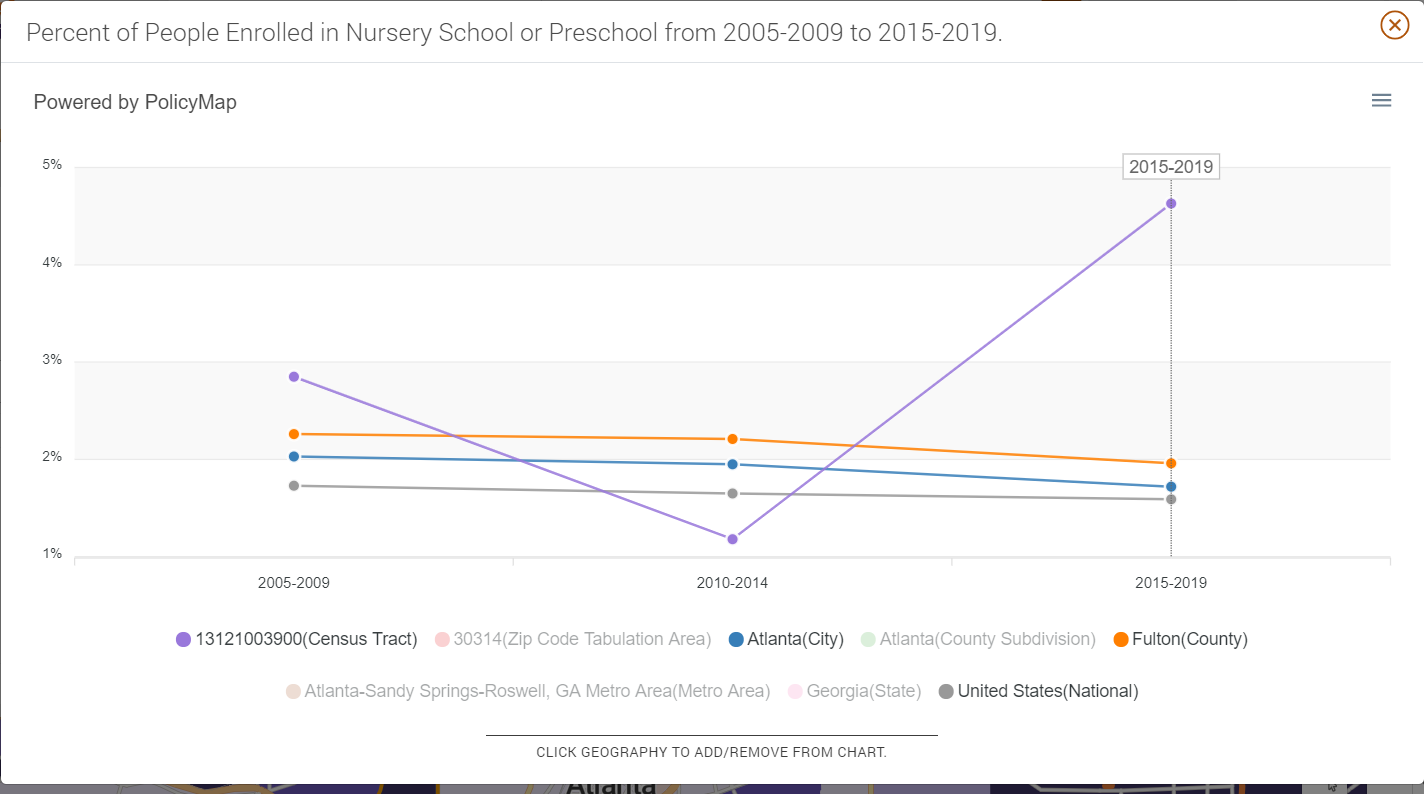
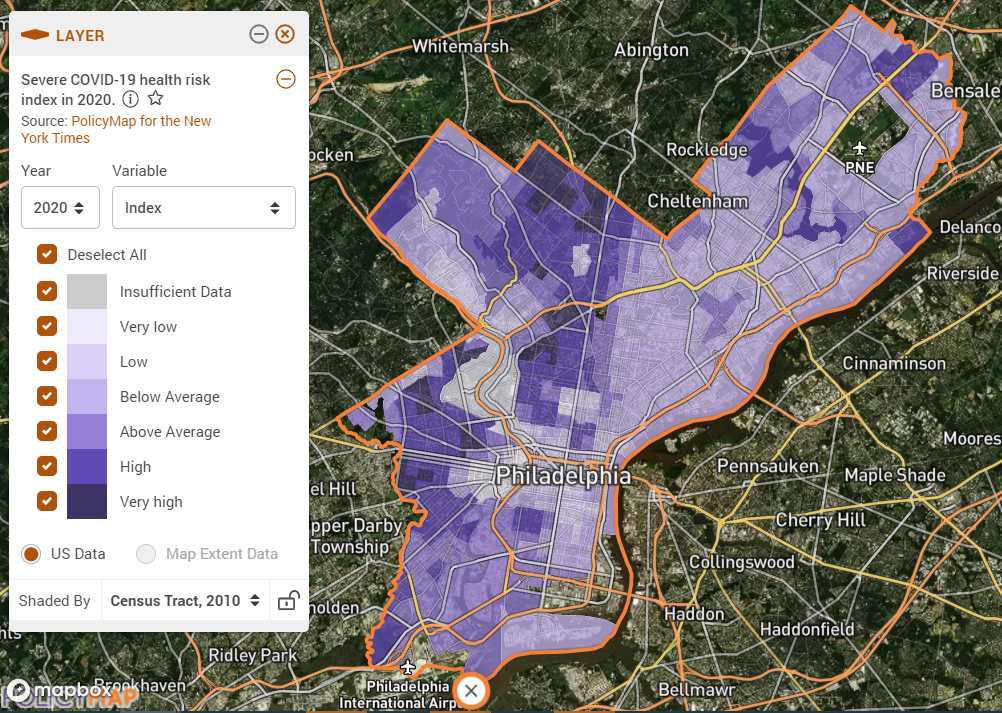
Dig deeper into data: explore new interactive trends charts, filter more than 3 datasets with new multi-layer mapping, create and edit custom regions, and select data ranges for map displays using histograms.
Tell Your Story with Maps
Create your own map with customizable icons and color ramps or “clip” your map to only show data for a specific area. Share your work by creating an interactive embeddable map or high-resolution exports.