
New Unbanked Data on PolicyMap!
Have you been to your local bank branch lately? Perhaps withdrawn money from your checking or savings account using an ATM? Many of us who have a relationship with a traditional financial institution may take it for granted, but a lot of people are without access to these institutions. Growing attention is being paid to households who are considered “unbanked,” meaning the household lacks any kind of deposit account at an insured depository institution, or “underbanked,” meaning the household has a checking and/or savings account but has also used alternative financial services (AFS) at least once in the previous year. In light of the growing interest in this area, we are pleased to announce that we have recently added state and metropolitan area level data from the 2011 Federal Deposit Insurance Corporation (FDIC) National Survey of Unbanked and Underbanked Households to PolicyMap.
As part of its efforts to address the research gaps around economic inclusion and to better understand the extent to which various types of households participate in the mainstream financial services or use AFS, approximately every two years, the FDIC conducts a national survey about household banking status. The survey estimates the percent of households that are unbanked, underbanked, or fully banked, and also collects information about what types of AFS these households are using. AFS, which include transaction-oriented products (non-bank money orders and non-bank check cashing) and the more commonly used credit-oriented products (payday lending, pawn shops, rent-to-own agreements), are increasingly accessible but generally come with much higher interest rates and greater fees than transactions through traditional financial institutions. These high-cost alternative services have grown so much that some argue that there are now more payday lenders than McDonald’s or Starbucks locations.
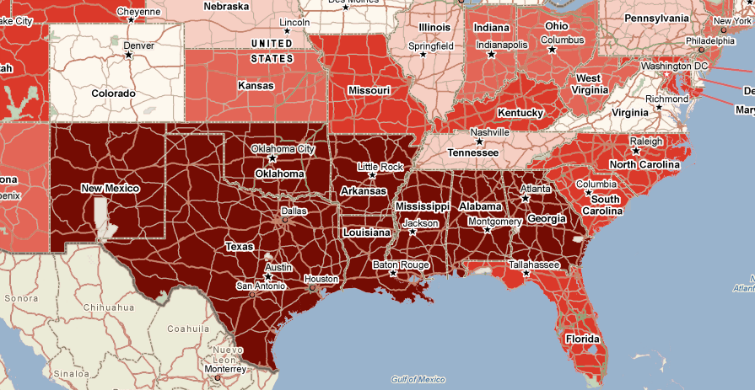
The map below shows how underbanked households are more prominent in the south, where payday lenders and rent-to-own businesses are thriving. In most southern states, close to a third of households are underbanked.
The unbanked and underbanked data on PolicyMap include breakdowns by household type, race/ethnicity, age, and education. Since many of our subscribers are focused on programs that increase financial inclusion, we hope these data (which can be found in the Lending tab) will prove useful to our users. If you have any comments on it or suggestions for additional datasets, please let us know!