
Opportunity Zones and PolicyMap
Note: This post is about the designation of Opportunity Zone tracts, the process of which is completed. PolicyMap now has Qualified Opportunity Zones available for use by investors, developers, and planners. For more information about how PolicyMap can help with Opportunity Zone planning, click here.
Data
Qualified Opportunity Zone Eligibility
Source
CDFI Fund
Find on PolicyMap
- Federal Guidelines
- Additional CDFI Fund Data
- Opportunity Zone Eligibility
- Additional CDFI Fund Data
Despite its party-line vote and controversial changes, the recent tax reform bill had one bipartisan element, Opportunity Zones, which are meant to encourage economic development in struggling areas, many of them rural. Originally a separate bill, it had support from Republicans and Democrats. The New York Times summarizes it thusly (in an article that also quotes Reinvestment Fund CEO and PolicyMap board member, Don Hinkle-Brown):
It instructs governors in each state and territory, along with the mayor of the District of Columbia, to designate Opportunity Zones from a pool of low-income, high-poverty census tracts, subject to certification by the Treasury secretary. States cannot nominate all their qualifying tracts for that status — they are limited to only a quarter of eligible tracts. Investors, like banks or hedge funds, then create Opportunity Funds to seed either new businesses in those areas, expansions of existing ones or real estate development.
Investors can defer up to nine years of tax on gains if the gains are invested in funds that invest in these areas.
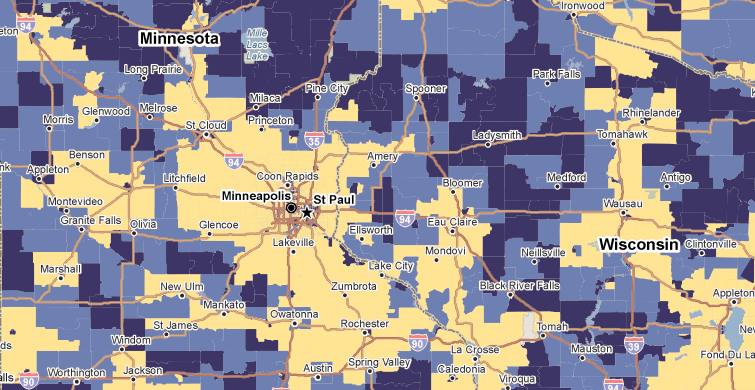
So how will state governments choose census tracts to be Opportunity Zones? Eligible tracts are Low-Income Communities (LICs), defined as having either (1) median family income at or below 80% of Area Median Income (AMI) or (2) poverty rate of 20% or greater in the period of 2011-2015. This happens to be the same eligibility criteria as New Markets Tax Credits (NMTC).
Eligibility updates by the CDFI Fund on February 27th, 2018, expanded the LIC eligibility definition to also include select qualified high migration tracts, low-population tracts within Empowerment Zones, and territorial census tracts that meet the LIC qualifications. These updates resulted in an additional 168 LIC eligible census tracts that do not meet NMTC eligibility criteria but qualify for Opportunity Zone designation.
Additionally, up to five percent of the nominated tracts can include eligible non-LIC tracts that are contiguous to a qualified LIC tract and have a median family income that does not exceed 125 percent of the median family income of the adjacent LIC QOZ.
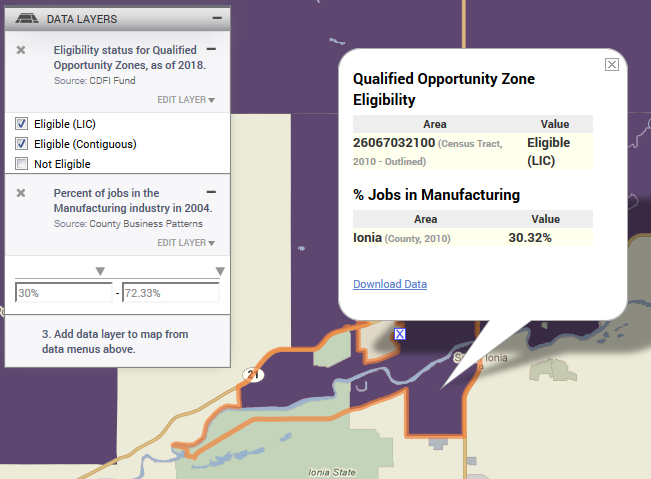
This eligibility data is on PolicyMap, including both LICs and eligible contiguous non-LIC tracts.
Because only a quarter of eligible tracts can be designated Opportunity Zones, it’s important to be able to narrow down the list of tracts to those that would be best served by the designation. By using PolicyMap, you can load other indicators that can help identify areas that would be best served by the Opportunity Zone designation. As the New York Times notes, it’s important that states designate tracts where major development isn’t already in progress; the goal is to encourage new development, not provide tax breaks for ones already started.
This is the PERFECT opportunity to use 3-Layer Maps, which let users load multiple indicators, and set criteria to find locations that match. So for example, if you wanted to find eligible areas that used to have lots of manufacturing jobs, you could load Census County Business Patterns manufacturing data along with the Opportunity Zone eligibility data, and choose only Opportunity Zone eligible areas where at least 30% of jobs were in manufacturing in 2004.
Of course, different states have different priorities. Lost manufacturing jobs aren’t part of the official Opportunity Zone selection criteria. This is one way for states to further their existing unique priorities through this new program.
You can then download a list of ALL the tracts that match the criteria in a given state. Too many tracts qualify? Limit the criteria further.
(Note: 3-Layer Maps is available to PolicyMap subscribers. It requires you to be zoomed in very close to see tract level data, like Opportunity Zone eligibility, on the map. Regardless, you can still download the list of tracts for the whole state. I recommend loading your other criteria first, like the county-level manufacturing data, where you can be zoomed further back, using the sliders to choose your criteria, then add the tract level Opportunity Zone data.)
Since Opportunity Zones and NMTC are both economic development programs, it might be helpful to look at where NMTC projects have been implemented in the past, to see areas that might be ripe for Opportunity Zone designation (or to look at it differently, areas to avoid because they have already received economic development aid). PolicyMap has data on the number and total value of NMTC projects, by tract and ZIP code.
The deadline to declare these Opportunity Zones is March 21, giving governors not very much time. Hopefully, a ready-made tool like PolicyMap can help out!