Persistent Poverty on a Neighborhood Scale

Data
Persistent Poverty Tract Status
Source
Census, Brown University, and PolicyMap
Find on PolicyMap
- Incomes & Spending
- Poverty
- Persistent Poverty
- Persistent Poverty Tracts
- Persistent Poverty
- Poverty
While the incidence of poverty has been increasing for the nation as a whole, there are a number of communities that have experienced high poverty rates for decades. The element of time is in fact critical in determining appropriate interventions for impoverished communities. A place with a high level of poverty last year but not this year is in much better shape than a neighborhood facing high poverty for multiple decades in a row. Identifying areas of long-term, concentrated poverty is important because it can be related to other issues such as poor housing and health conditions, higher crime rates, poor child development and educational outcomes, and employment dislocation.
Given the importance of this issue, we’ve added persistent poverty data at the census tract level to PolicyMap. While we’ve had county-level persistent poverty data from the Community Development Financial Institution (CDFI) Fund available for some time now, this new data provides users with a more granular look at neighborhoods facing long-term poverty.
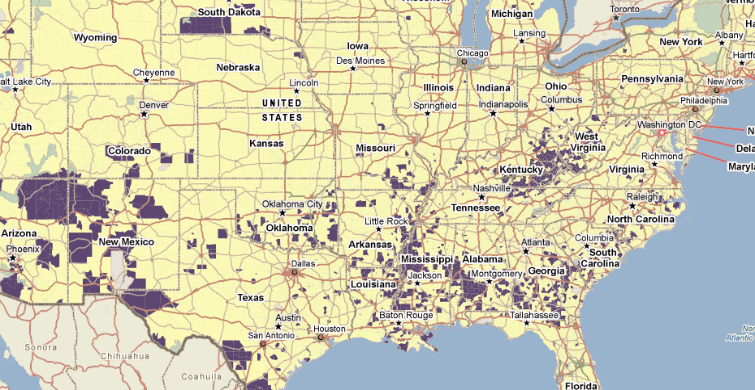
How did we determine persistent poverty tracts? We started by getting permission from the good folks at Brown University’s Longitudinal Tract Database (LTDB) to use their poverty data from the 1990 and 2000 censuses and the 2006-2010 American Community Survey, which they calculated all at the 2010 boundaries so they could be compared. In deciding how to define persistent poverty tracts, we opted to use a similar definition to the one used by the CDFI Fund in determining persistent poverty counties, which is to consider any tract for which at least 20 percent of the population has been living in poverty for the last 30 years to be a persistent poverty tract. Using this measure, just under 13% of census tracts in the United States are facing persistent poverty.
The causes of persistent poverty are systemic and complex. Yet, it is important to note that the conditions and solutions vary greatly between rural and urban areas. Persistent poverty has historically been viewed as a largely rural phenomenon in the US, and as you can see in the map below, persistent poverty tracts continue to be heavily represented in places such as Eastern Kentucky and other parts of the rural south.
However, persistent poverty is a daunting problem in many urban neighborhoods as well. In this article published last year, researchers from the Urban Institute explain the issues specific to urban areas and provide an overview of “place-conscious” strategies currently being pursued in various cities. Their research also highlights how persistent intergenerational poverty impacts minority communities disproportionately, especially communities where minorities are the overwhelming majority. Taking a quick look at the maps below of Baltimore, showing persistent poverty followed by the predominant race/ethnicity, you can see that in urban areas, persistent poverty too commonly occurs in overwhelmingly minority neighborhoods. Exploring other cities in a similar fashion reveals similar trends.


If you are interested in learning more about how Brown University’s LTDB team harmonize tract-level data at the 2010 boundaries, please visit their website. Further explanation of the methodology can also be found in the Professional Geographer’s forthcoming article entitled “Interpolating US Decennial Census Tract Data from as Early as 1970 to 2010: A Longitudinal Tract Database,” which was authored by John Logan, Zengwang Xu, and Brian Stults.
We hope you enjoy this new addition to PolicyMap! If you are interested in other related data, be sure to dive into the wealth of other interesting data in our Incomes and Spending tab, including persistent poverty counties, economic mobility, and location affordability.