
Presenting the Community Profiles Mapping Tool
Subscriber Spotlight: Minnesota Housing Community Profiles
Minnesota Housing Finance Agency worked with PolicyMap to develop Community Profiles, an interactive web-based mapping tool to help guide investment decisions to maximize impact. Community Profiles – not to be confused with PolicyMap’s Community Profile Report – features twenty-four indicators related to the housing market, household demographics, and economy and workforce. The indicators were selected to assist Minnesota Housing and partners in allocating limited resources as effectively as possible to meet the substantial and increasing demand for affordable housing throughout the state.
Minnesota Housing and its partners at the Greater Minnesota Housing Fund and USDA Rural Development are using Community Profiles as the basis for a series of regional affordable housing dialogues. The dialogues feature regional assessment presentations, using mapping to facilitate discussion.

Community Profiles is also designed to make community-level data available to applicants to Minnesota Housing multifamily and single-family programs. Applicants can get information through printed map or data download, or they can create a custom report for their target area with all the information they require for the application.
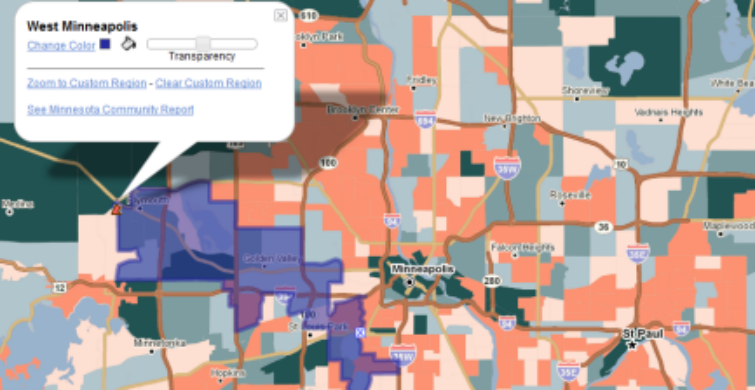
The Minnesota Housing widget contains a number of new features previously unavailable to our widget customers. These new features allow visitors to their widget to:
- Generate a custom report on the fly for any tract or county in Minnesota.
- Build custom regions by drawing on the map, or by selecting groups of tracts or counties.
- Color-code polygon datasets and color-in custom regions.
Interested in incorporating any of these new features into your own work? Contact us now.
New Data for Your CDFI Fund Applications: Persistent Poverty
Persistent Poverty data is now available on PolicyMap for those of you completing your Financial Assistance, NACA Program, and/or Healthy Food Access Funding Proposals for the CDFI Fund. You can find this county level indicator in our Federal Guidelines tab.
New Data: Housing Choice Voucher (HCV) Opportunity Index:
Every so often we hear from you about a dataset you really want to see on PolicyMap. In response to several recent requests, PolicyMap now offers the Housing Choice Voucher (HCV) Opportunity Index. You can access it now under the Federal Guidelines tab.
The index was developed to complement the Department of Housing and Urban Development (HUD) Housing Choice Voucher (HCV) program, which is a rent-subsidy program for low-income families. Although one of the goals of the program is to deconcentrate poverty by providing households with the flexibility to purchase housing in the private market, research has shown that many families end up in neighborhoods with above-average poverty levels. The HCV Opportunity Index uses factor analysis to identify “opportunity” neighborhoods for voucher-holders in places with low levels of poverty and low levels of occupancy by other HCV households. A full description of the index, how to use it, and how it was calculated is available here or visit PolicyMap to see where the opportunity neighborhoods are in your area.
New Feature: Color-in Custom Region
For some time now PolicyMap subscribers have been able to draw on the map or assemble geographies to create unique target areas for analysis. Now PolicyMap subscribers can further customize maps by changing the color of custom regions, and coloring-in the area inside of custom regions. We even have a transparency bar for the colored-in shade, a great option for those trying to overlay multiple custom regions at once! Read more about how the new custom region on our blog.
If you’re not a subscriber but want to try out this new feature you can visit Minnesota Housing’s new custom widget here.
April Data Updates
- 2010 crime data from the FBI Uniform Crime Reports (Neighborhood Conditions)
- Nonprofit locations as of 2011 from the National Center for Charitable Statistics (Nonprofit Locations point data)
- 2009 food stamp data from Census’ Small Area Income and Poverty Estimates (Money & Income)
- 2008 and 2009 Census Small Area Health Insurance Estimates (Health)
Coming Soon!
The PolicyMap team is hard at work updating our boundaries to the new 2010 Tiger files and processing the 2006-2010 American Community Survey (ACS) 5-year estimates. Keep an eye on our blog or follow us on Facebook for all the latest!