
Using Data to Guide Low Income Housing Tax Credit (LIHTC) Preservation Efforts
Data
LIHTC
Source
HUD Low-Income Housing Tax Credit (LIHTC) Database
Find on PolicyMap
- Housing
- Federal Housing Data
- LIHTC
With tax season here, many people will soon be feeling the benefits of homeownership. However, despite the tax benefits of homeownership and its portrayal as being part of the American Dream, the reality is homeownership is declining and rentership is on the rise. Over a third of households now rent their homes, representing a 20% increase since 2000. The supply of affordable rental housing has had a hard time keeping up with demand, particularly for low-income households. As a result, the average renter household now spends 1/3 of their income on housing, compared to 1/5 of income for the average owner household. Of the many national, state and local programs that have emerged to address the affordable housing crisis, Low Income Housing Tax Credits (LIHTC) have consistently been the most prominent. Experts estimate that between 1987 and 2006, LIHTC accounted for approximately 1/3 of all multifamily rental housing constructed.
Given the paramount role that LIHTC plays in meeting the growing demand for affordable rental housing, it is not surprising that as more properties approach expiration of their affordability restrictions, efforts to preserve affordability of existing units has been a growing housing policy focus. Not only is preserving existing affordable housing cheaper than building new housing, but it also prevents resident displacement and takes advantage of existing land use patterns. According to the Joint Center for Housing Studies 2017 Rental Housing Report, 478,000 units with LIHTC subsidies are set to expire over the next decade. PolicyMap users can explore LIHTC data to see the geographic distribution of these expiring properties (as demonstrated in the map below).
When does a LIHTC property expire? For readers who may not be familiar with the nitty gritty, here is a brief summary. The Tax Reform Act of 1986, the original legislation establishing LIHTC, required that properties remain affordable for a 15 year period. However, further legislation in 1989 extended the compliance period to 30 years. Yet, although LIHTC properties placed into service after 1990 are subject to a 30 year affordability period, there are a number of circumstances that can make a LIHTC property owner eligible to leave the program at Year 15. As HUD examines in-depth in this report, what happens with a property at year 15, and whether it continues to remain affordable, depends on many factors such as the local housing market, funding streams and political climate. Even for LIHTC properties that do retain affordability requirements after Year 15, getting to this juncture presents property owners with a wide range of challenges such as how to finance repairs and rehabilitation of aging properties, deal with common management issues, and manage the debt remaining from the original compliance period. Novogradac has compiled a LIHTC Year 15 Handbook as a guide for owners navigating the complex web of challenges that come with Year 15.
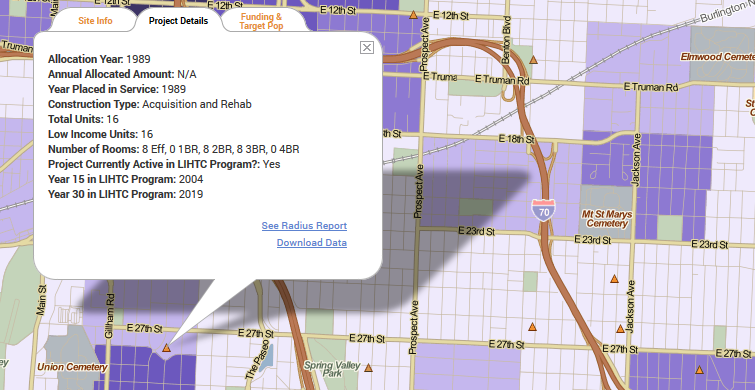
To make it easier for housing advocates to explore potentially expiring properties in their local area, PolicyMap allows users to filter properties by when they reach Year 15 and Year 30 in the program. Advocates can then review these properties in relation to local market conditions. The map below shows LIHTC properties that will be reaching the end of the initial 15 year compliance period in Cleveland, Ohio before 2025.
CHN Housing Partners, a local housing organization in Cleveland, have been pioneers in linking LIHTC properties to a lease to purchase program, thereby helping LIHTC tenants transition to homeownership in Year 15 (while providing educational and support services along the way). While this strategy makes sense for targeted neighborhood revitalization in markets with enough single-family homes, there are a number of other strategies that can be employed in other geographic, economic and political contexts.
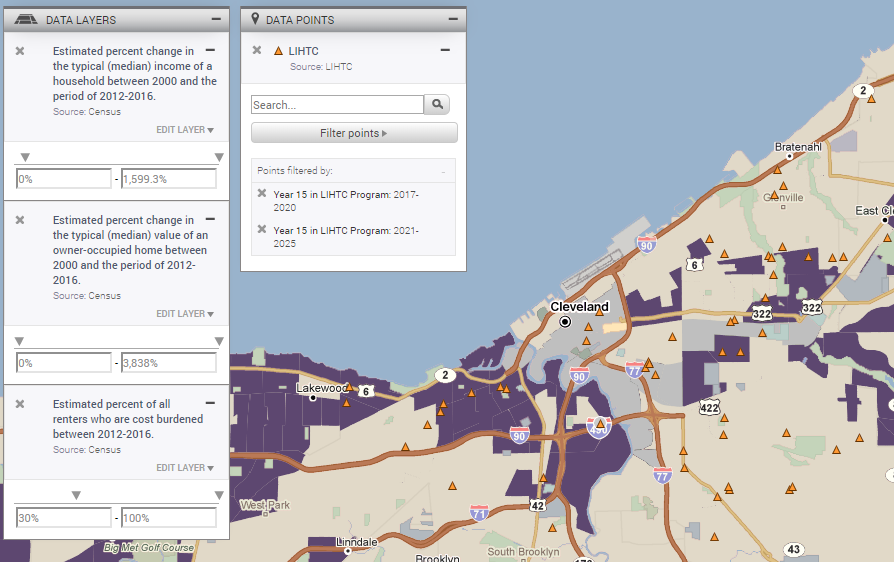
Given that the loss of affordable housing can be particularly severe in stronger markets, it can be helpful to examine market dynamics in areas where potentially expiring properties are located. This is where PolicyMap really comes in handy. Using our 3-Layer Maps feature, the image below shows areas in Cleveland where the market is getting hotter (as indicated by growing household income and home values) and renter cost burdens are high, thus suggesting that the existing affordable housing stock may be at even greater risk. Other data on PolicyMap that could help to illuminate areas with heightened risk of displacement include declining vacancy rates, increasing racial/ethnic diversity, and growing educational attainment, to name a few.
For readers interested in learning more about affordable housing preservation efforts, the National Housing Preservation Database (NHPD) is an extraordinary resource. In addition to offering a detailed national address-level inventory of federally-assisted rental housing (which includes a de-duplicated list from LIHTC and other housing programs), the NHPD also houses a collection of resources to guide in affordable housing preservation strategies and Preservation Profiles by state.
You might find yourself wondering how the recent tax reform bill will impact LIHTC, as these credits are tied to the corporate tax rate. The good news for affordable housing developers was that Congress kept this critical means of creating affordable housing in place; LIHTC continues to be preserved in the tax code. The not-so-great news is that the corporate tax rate reduction from 35% to 21% will arguably make the credit less impactful. Novogradac estimates the final tax reform bill will result in a reduction of around 235,000 affordable homes over 10 years.
We hope these resources prove helpful for users engaged in efforts to assess and preserve the existing affordable housing stock around the country.