
Research Your Community Tutorial
Research Your Community is a new mapping tool available on HealthyFoodAccess.org. The following tutorial will help you use the map and report to understand food access issues in your community.
To get started: select your area of interest by typing in the name of any state, city, county, or ZIP code. The search bar will auto-populate as you type. Simply choose from the drop-down menu and click Submit. The map will center on the chosen area, and the option to generate a report will appear below the map.

Selecting a new location with the search bar will reset the map.
Data Layers
Two types of data are available: layers and points. Data layers shade the map using geographies such as census block groups, counties, and ZIP codes. For example, areas with high population are shaded darker on the map, while less populated areas are shaded lighter; these cut points are displayed in the legend to the left of the map. Each layer has a description, which you can read by clicking the “details” button at the top of the map. This description also links to extensive documentation of the original source, when the data was last updated, and other pertinent details.
To add a layer, navigate through the four data categories and submenus: Health, People, Food Access, and Federal Programs & Investments. Clicking the text will load the data layer on the map. Selecting another data layer from the menus will change the data displayed on the map.

The Info Bubble
To see data values, click on a shaded area of the map. The info bubble will highlight the value for the geography the data layer is shaded by, and will also show any larger geography with available data (such as the county a census tract sits within).

Points
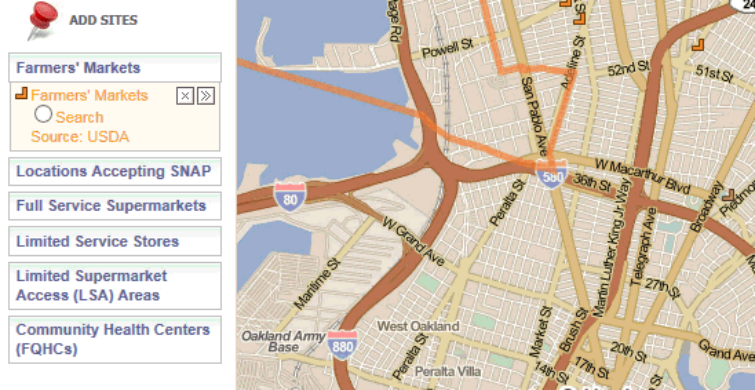
Locations of key food access and health resources are included in the tool under Add Sites. Use the menus to add points to the map. The icon is displayed in the menu once a point dataset is added. Click this icon on the map to see more information about an individual location. Many point datasets can be filtered/color coded. Click the [X] to remove points from the map.

Generating a Report
Research Your Community features a web-based report that includes essential data on the food environment, demographics, health status, and available funding opportunities in your community of interest.

For more information, contact morgan.robinson@policymap.com.