School Performance Data Now Updated

Though the No Child Left Behind Act continues to be controversial, there’s no denying the vast amount of school performance data it has created over the years since its inception. Years of nationwide standardized testing have created a trove of data, much of it available on PolicyMap.
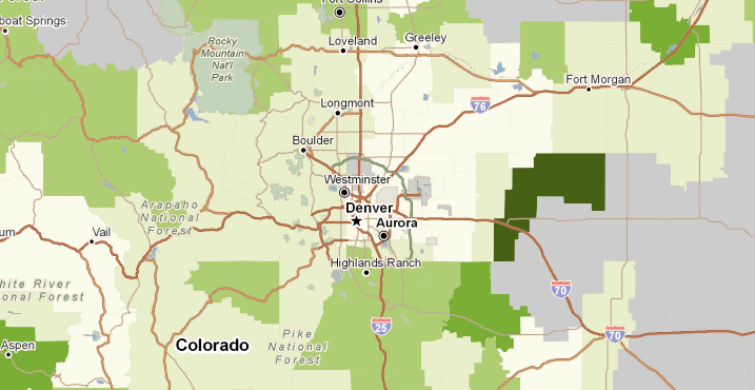
For free, PolicyMap users can access school district reading and math scores for 4th grade, 8th grade, and high school. This data, showing the percentage of students in the district who are “at or above proficient”, comes by way of the New America Foundation. It’s available in the Education menu, under “Overall Student Proficiency”.
Users looking to get a little more in-depth and wide-ranging data should look at our GreatSchools district performance data. This data isn’t limited to specific grades and subjects; it has a huge selection of different tests, subjects, and grades to look at. Want to know which school districts in New York did the best on the 11th grade French Regents Exam? Or the Virginia high school test of Virginia and United Station History? It’s all included.
GreatSchools also offers school district ratings based on the scores of the districts’ schools, giving each district a score from 1 to 10. Note that because each state uses different tests given under different conditions, scores and ratings from one state are not comparable with those from another state.
So how much data is this? Because of the magnitude of the GreatSchools district performance data, the Education menu is the largest menu on PolicyMap (including the submenus). With so many state/test/subject/grade combinations, it can be a lot to navigate, but everything is in alphabetical order by state, then subject, then test. Every test has different years of data available. We have much more information on each test at our Data Directory page.
The GreatSchools data is available to paid subscribers, or you can check it out with a free 7-day trial.