
New Student Loan Debt Data Available on PolicyMap
It’s common knowledge that student debt has been on the rise in the United States, but the extent of the increase might startle you. According to the Pew Research Center, average student debt was $9,600 in 1989. By 2001, it grew to $17,600. In 2010, average debt was $26,700!
PolicyMap recently added data on average student debt from The Institute for College Access & Success (TICAS). This is sample data, so comparisons from one year to the next are problematic. However, the universal upward trend is striking. The table below shows the annual numbers reported by the six largest states. Student debt is climbing faster in some places than others, but it’s climbing everywhere. The fastest growth seems to be in the northeast states, such as New York and Pennsylvania below:

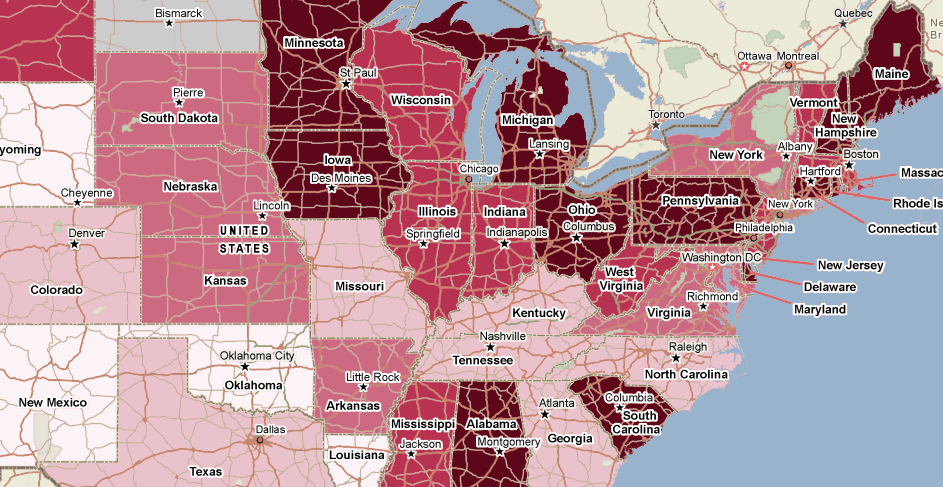
Student debt in 2012 varies widely across the country, from $18,000 in New Mexico to $33,000 in Delaware. Generally speaking though there are regional trends. The map below shows higher overall debt rates in the northeast and Midwest, with lower average debt in the west and southwest.
Data on student loan debt is available in the Education Menu. Data include average cumulative debt and percent of students completing their undergraduate education with student loan debt. You can also see the numbers broken out for private nonprofit and public institutions. Data are available at the state level going back to 2004, and in some cases to 2001. Data are not comparable from year to year due to changes in the samples gathered in school surveys.