
The Next Big Thing at PolicyMap
We founded PolicyMap on the belief that data has the power to change communities and markets – but that finding data and showing it on map was too difficult. Data was trapped in organizational and governmental silos, came in too many formats, and was hard to understand. If you could find the data, getting it on a map took a set of technical GIS skills only few possessed, not to mention prohibitively expensive and complicated software.
Problem: Data can lead to vibrant communities and markets, but the challenge of finding data and the complex, expensive software needed to analyze and map it often limit its use in decision making.
 We didn’t set out to build tools for web developers or ArcGIS map makers. Instead, we set out to build a tool designed for the person who needed data and maps to focus scarce governmental resources, evaluate changes in a neighborhood, choose sites for properties, look at investments agencies were making across the US, and generate quick market studies.
We wanted students who would never experience a “GIS” class to understand what it meant to look at data on a map – not to find driving directions or a restaurant – but to learn about the places they were studying. We wanted to empower our next generation of leaders with an understanding and appreciation of place: the dynamics that shape a community’s health, economic opportunity, housing quality, and more.
Solution: A unique web-based mapping platform, with an extensive data warehouse and simple user interface designed for the non-tech user.
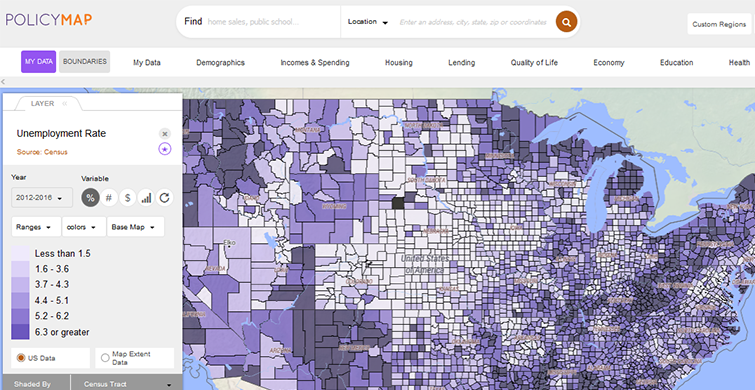
PolicyMap has always offered the most reliable, authoritative, relevant, and timely place-based data on the web, with the most indicators from the largest number of sources. We’re getting ready to offer that data on an all new mapping platform.
 This new version of PolicyMap will have the latest web mapping technology, allowing better-looking maps, all new features, and faster performance. We will continue to provide the friendly customer service and data insights that you rely on, but with much more on top of our current service.
What’s new with the new PolicyMap?
- A new vector-based mapping engine with fluid, contemporary, seamless maps
- A flawless experience on mobile devices
- The ability to view and analyze data at a parcel level and contextualize with 3D representations of buildings
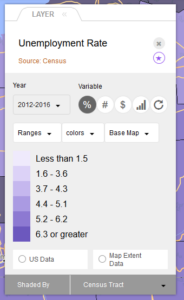
- The ability to customize by annotating or drawing on the map, switching base maps, and automatically adjusting ranges for the data on the map
- Interaction with irregular data such as flood zones and zoning boundaries
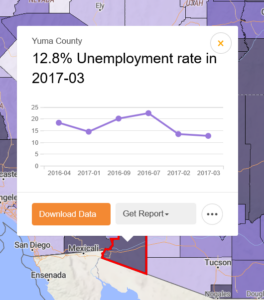
- Change-over-time trend charts with just a mouseover
- New ways to visualize data beyond maps
- Available curated data selections to help solve specific problems
 Importantly, with this new mapping engine, we’ll be able to respond to the changing needs of our users and quickly develop new features we haven’t even thought of yet.
And along with these technical upgrades, we’ll continue to develop new unique data offerings unavailable anywhere else.
We’ll always be the PolicyMap you’ve relied on, but get ready for a new level of experience.
The screenshots on this page are an early look at what’s in development. While the planned release date is later in 2019, we’ll be writing more about this over the coming months, so sign up for email updates to stay up to date on our latest developments.