
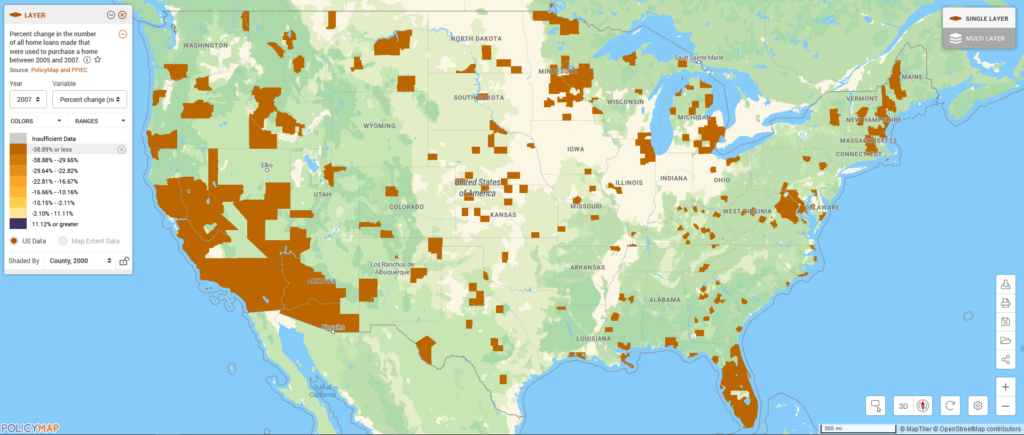
Largest Drop in Home Loans Between 2005 and 2007

In a couple of days, we will be getting 2008 HMDA data available on PolicyMap, which will provide details about and insight into the recent housing and mortgage crisis. The current issue of the Federal Reserve Bulletin has an article analyzing this recent data (available here HMDA 2008), and found a few trends. According to the report:
The 2008 HMDA data reflect the ongoing difficulties in the housing and mortgage markets. Reported loan application and origination volumes fell sharply from 2007 to 2008 after already falling considerably from 2006 to 2007. The reduction in lending occurred among all groups of borrowers regardless of race, ethnicity, or income, although lending for some groups declined more sharply than for others.
So, in preparation for the upcoming 2008 data, let’s look at the metropolitan areas that declined most significantly between 2005 and 2007. When this data is posted to PolicyMap, we’ll look at these cities again. One question to look for is whether a large decline before 2008 predicts a large decline in 2008, or whether it means the mortgage market already bottomed out in those places. In the next few days, we’ll look at other statistics from 2007 to prepare for what we might see in the 2008 data.
Highest negative percent change in the number of all home loans that were made between 2005 and 2007
Do you want to learn more about this dataset or other features on PolicyMap? Join our free weekly trainings (Click Here) or send your questions to pmap@policymap.com.