
Zip Codes with the Most Housing Units Built Before 1940
To see where the nation’s aging housing stock is, we can look at Census and Claritas estimates, with detail down to the block group. Other age buckets include houses built in 1940-1969, 1970-1994, 1995-1998, and 1999-2014. You may wonder how there are statistics for houses built-in 2014: this is from Claritas’s 2014 projections.
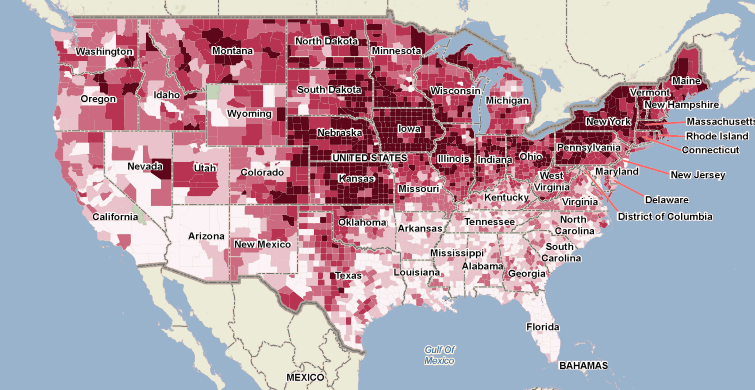
Estimated percent of all housing units built in 1939 or before, as of 2009
| Zip Code, State | Estimated percent of all housing units built in 1939 or before, as of 2009 |
|---|---|
| 92135, CA | 96.15% |
| 61625, IL | 88.89% |
| 01063, MA | 87.18% |
| 02108, MA | 80.08% |
| 02113, MA | 78.83% |
| 18232, PA | 78.36% |
| 17948, PA | 78.05% |
| 60304, IL | 76.74% |
| 14613, NY | 75.28% | 12305, NY | 72.98% |
Do you want to learn more about this dataset or other features on PolicyMap? Join our free weekly trainings (Click Here) or send your questions to pmap@policymap.com.
![]()