
HUD Data Paints A Picture of Subsidized Households
The most recent year of data from HUD’s A Picture of Subsidized Households is now on PolicyMap. Use this data to understand how federal housing programs affect the rental environment in a community.
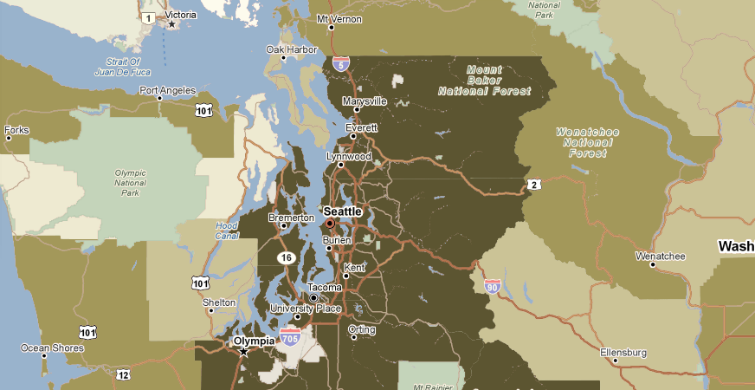
The 2009 data for subsidized households can be found in the Owners & Renters menu on PolicyMap. The map below shows the percentage of all rental households, by place, receiving Section 8 vouchers in the Greater Seattle area. A moderate percentage of renters are voucher recipients in Seattle proper. Voucher recipients represent a much greater proportion of renters in Tacoma and the surrounding suburbs, as well as a cluster of suburbs north of Seattle, along the I-5 corridor.
In addition to seeing the cities, counties, and tracts where federally-subsidized housing is concentrated, this data also features basic characteristics for people living in a subisidized household. See the average rent in dollars as well as a percentage of the Area Median Income, and demographics including age, race, household size, and type.
Some subsidized households indicators for 2009 have limited coverage, especially at the tract level; the 2008 data have more complete coverage and are still available for use as well.