
Updated School Performance Data Now on PolicyMap
School may be out for the summer (or maybe not), but now is a great time to look at school performance statistics in your community. That’s because PolicyMap now has updated data from GreatSchools, an organization that collects standardized test scores and other school performance metrics for public and charter schools around the country.
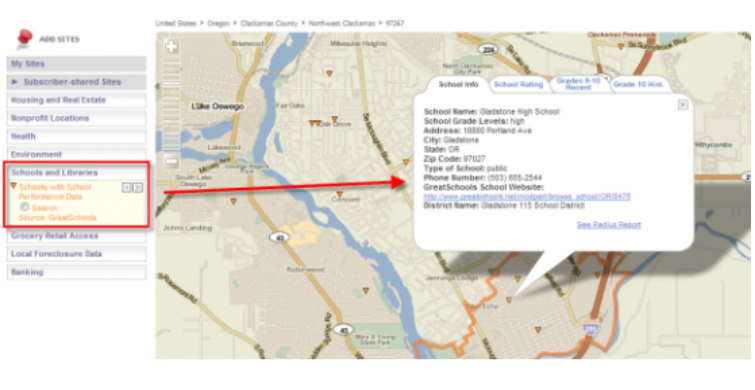
Subscribers and trial users can click on any school, and will be able to see basic facts about the school (its name and address, grade levels, school district, etc.), its GreatSchools rating (on a scale from 1 to 10), and the percent of its students who scored at or above proficient in various standardized tests.
With this update, we’ve made this data easier to use. When you click on a school, the info bubble has the test scores of different grades divided onto different tabs. So, grades 1 through 3 are on one tab, 4 and 5 on another, and so on. Additionally, because there are scores for up to five previous years, we’ve made one tab with just the most recent data, and another with all the historical data, so you can look at trends at the school over time.

The GreatSchools rating is based on the test scores as compared to test scores of other schools within the same state. Therefore, one should not compare the GreatSchools rating of schools in different states.
Because this is proprietary data collected by GreatSchools, this data is available only to PolicyMap subscribers and trial users. Non-subscribers can still see basic information about the school, such as name, school district, and address. The data can be accessed by going to the “Schools and Libraries” menu in the Add Sites section, and clicking on “Schools with School Performance Data”.