
Using PolicyMap to Assess and Address Threats to Public Benefits

Federal government agencies like HUD and the USDA provide some of the most critically needed housing resources across the country. With portfolios of housing investments in the hundreds of billions of dollars, risk assessment for the preservation of affordable housing is a monumental effort.
Because many federally supported housing programs provide subsidies through loans to developers that can mature, the assistance provided to renters in subsidized properties can expire, resulting in the rental units demanding market rent rates.
In short, without data and mapping tools, federal agencies may run the risk of losing affordable housing as their investments mature.
Identifying Expiring Subsidies
Preserving the affordability of USDA Rural Development (RD) properties is crucial to the well-being of many low-income Americans, but assessing the risk of loss requires data to understand the unique needs and risks of each property to appropriately target interventions.
In 2017, USDA RD had one of the largest portfolios of loans for multi-family affordable housing in the United States. It had $10.5 billion invested in their Section 515 Direct Loan portfolio, which provides loans to multi-family housing developers, resulting in rental assistance for nearly 275,000 households.2
However, USDA RD properties only carry that rental assistance for about 30 years, and many of the properties were beginning to “age out” of their affordability through loan maturation. Unlike traditional portfolio risks that traditional lenders have, the USDA RD’s portfolio risked a significant loss of affordable housing.
They needed a simple way to assess which places in the U.S. had the greatest risk of losing housing crucial to their low-income constituents. They created a map visualization (shown below) showing where their maturing loans were located against concentrations of cost-burdened renters (indicated in dark purple). Using the map, they could instantly assess where they needed to focus their efforts to try to ensure continued affordability.
Once they could identify the properties whose affordability was most critical to “save”, the USDA RD could enlist the help of nonprofits to take over the loans in order to extend the loan for as much as 20 years, providing continued rental assistance.
Finding Solutions
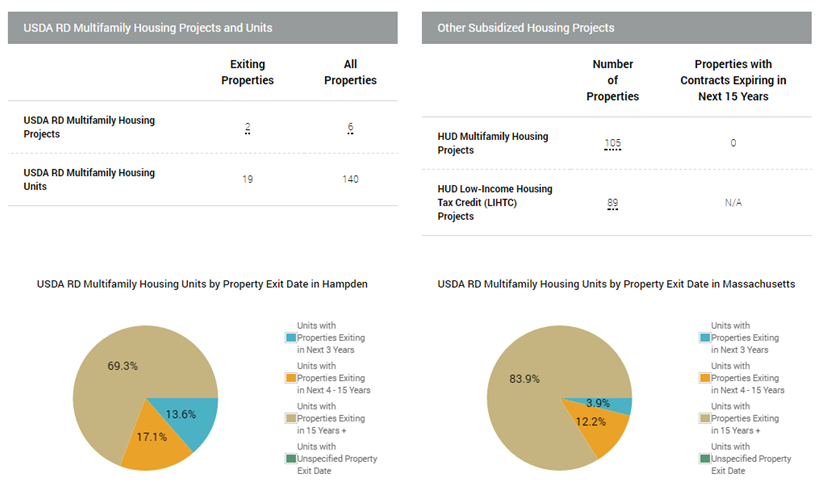
But before going down that path, the USDA RD wanted to know if rental assistance might be available from other sources. By looking at information about other subsidized housing projects in the area, they could quickly determine which parts of the country had the most urgent need for housing affordability preservation.
By looking at a county where they had investments, such as Hampden, MA, they could look at the county compared to the state, and determine if other subsidies, such as HUD housing investments and Low-Income Housing Tax Credits, might provide affordability support. This would allow USDA RD to focus their efforts elsewhere.
By using data displayed in simple ways on maps and tables, analysts without GIS or data experience could easily and quickly ascertain risks to affordable housing across their extensive portfolio and, in turn, more quickly address threats to affordable housing.
This post was adapted from our recent white paper, “Sharing Insights, Saving Time: New Data Tools for Government.” You can download the complete paper here.