
Return to Sender: Vacancy Data Updated on PolicyMap
Whether you are a local government agency seeking to understand the regional housing market or a Community Development Financial Institution looking to revitalize commercial strips in Ohio, tracking vacancy trends is a need shared across all sectors. Given its far-reaching utility, vacancy has historically been one of our most sought-after datasets on PolicyMap. We are excited to announce that we have again enhanced the vacancy data offered on PolicyMap, and it is now available through Q4 of 2015.
As many of our long-time users are aware, we used to provide vacancy data made available through the Department of Housing and Urban Development (HUD) and the United States Postal Service (USPS); however, in 2010, this became available only to approved government and non-profit users. We have since been offering vacancy data from a proprietary source, Valassis Lists, a direct mail company that processes direct feeds from a combination of USPS databases. PolicyMap now plays a more integral role than ever in the creation of the data we show in order for it to more closely match the HUD/USPS data. We now receive address level vacancy and no stat data, which we aggregate ourselves to the block group, census tract, zip code, city, county, metro and state. Based on extensive inquiry and validation of the data we’re aggregating, we believe the Valassis Lists data will provide our users with the most accurate estimates possible. This direct mail data aggregation approach is also exciting because it reflects conditions on the ground as they are– vacant addresses are recorded as such after 90 days of uncollected mail.
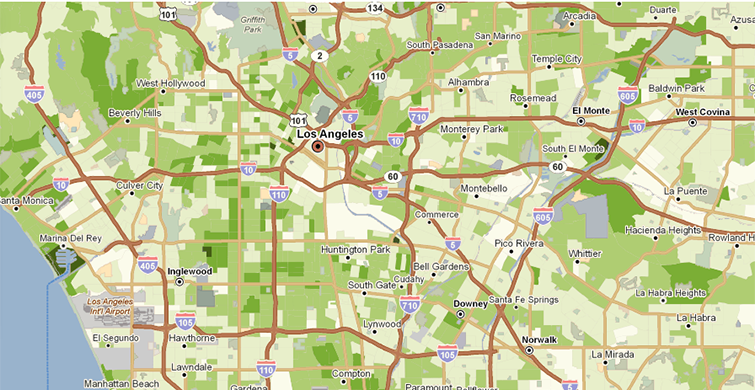
The map below shows how the housing market in southern California is extremely tight, with some of the lowest residential vacancy rates in the nation.

The exceedingly low residential vacancy in the Los Angeles area has great implications on housing prices and affordability. A quick look at housing and renter cost burdens in the LA area (available from the Census’ American Community Survey) reveals that a large percentage of owners and renters in the land of sunshine are extremely cost burdened and pay more than 50% of their income on housing.
Valassis’s vacancy data is also useful for tracking change in the commercial market. The map below shows how the commercial market has also continued to get tighter in the LA area over the last year. All shades of orange represent a decline in commercial vacancy (with the darkest shades suggesting the greatest decline). The very few cities shaded in green saw an increase.

The Valassis data are only available for paid subscribers and, due to licensing restrictions, are not downloadable from PolicyMap. For users who do not have a paid subscription, we continue to make the HUD/USPS vacancy data available (also in the Housing menu).
It is important to note that in some areas (particularly rural areas), looking at vacancy and no stat together can provide a more complete picture than just vacancy alone. No-stats are inactive addresses that are under construction, demolished, blighted, or are otherwise unable to receive postal mail. They also include rural route addresses that are vacant for more than 90 days.
Lastly, while the vacancy and no stat data from Valassis Lists can be highly informative, it should not be expected to be exactly comparable to the data from HUD or other vacancy sources. Whenever possible, it is best to supplement this national data with on-the-ground knowledge of vacant properties and businesses in your local target area.