
Visualizing Racial and Ethnic Diversity

Data
Racial and Ethnic Diversity
Source
U.S. Census American Community Survey (ACS), PolicyMap
Find on PolicyMap
- Demographics
- Race, Ethnicity, Diversity
- Race, Ethnicity, Diversity
With the release of the 2020 Decennial Census data, we learned our nation is more diverse than ever, and that this trend is expected to continue. Visualizing racial and ethnic diversity across the nation at various geographic levels is a powerful tool for digging deeper into socioeconomic gaps and trends. PolicyMap has updated the Diversity Index and Predominant Race/Ethnicity data to 2020, the latest 5-year ACS time frame. New for this year we have also added the Predominant Racial Group dataset. These datasets now contain previous time frames as well, allowing for comparisons over time.
Nationwide Population Trends
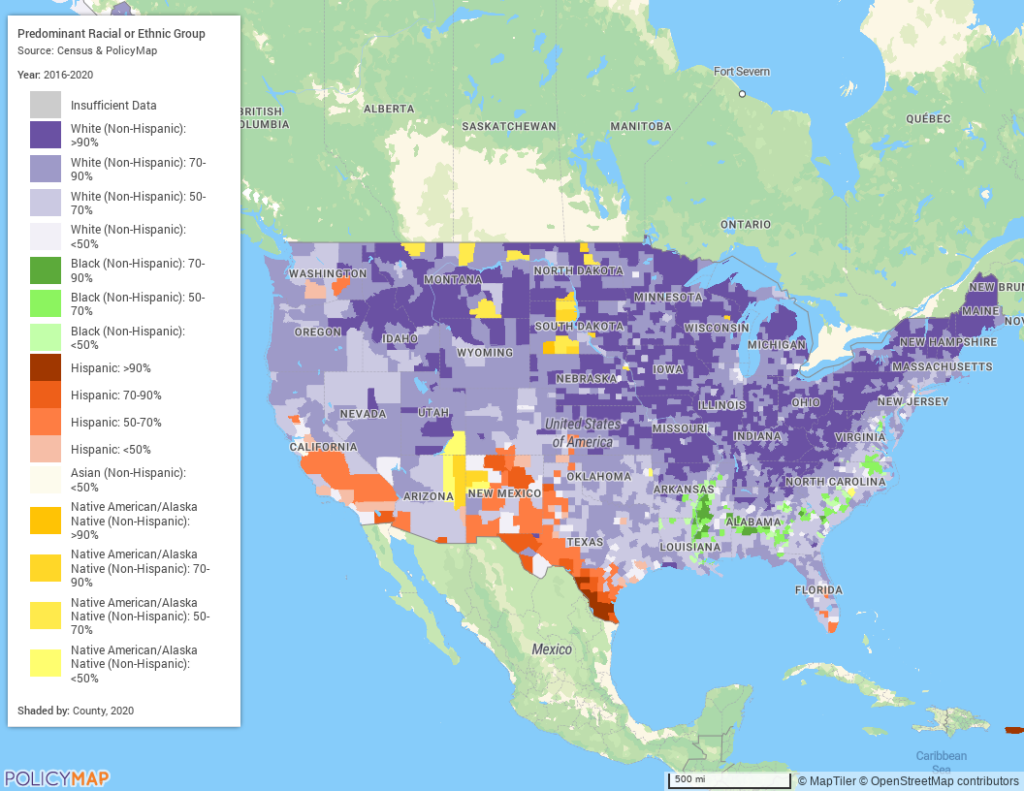
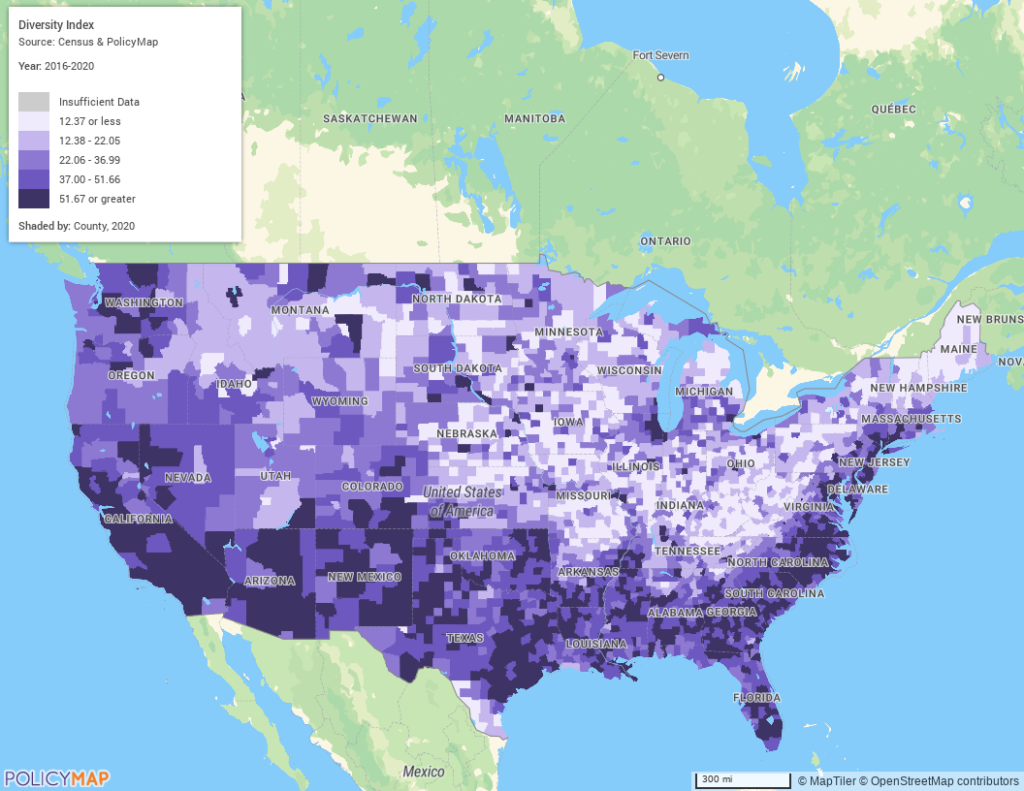
The nationwide map of Predominant Race/Ethnicity below shows areas of predominantly Black (Non-Hispanic) counties in the south, predominantly Hispanic counties in the Southwest, and a few counties that are predominantly Native American/Alaska Native (Non-Hispanic) throughout west. Below that, the nationwide Diversity Index map shows areas that have very high concentrations of certain Races or Ethnicities are the ones that have the lowest Diversity Index numbers.
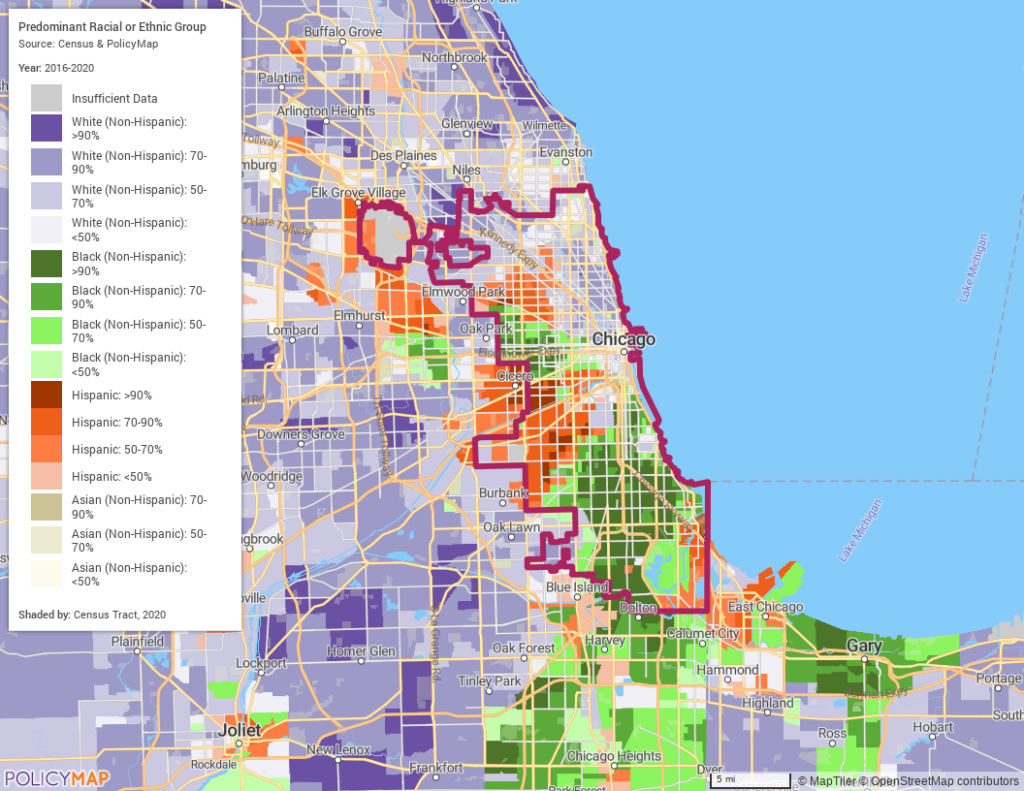
Neighborhood-level Diversity in Chicago
Since PolicyMap includes smaller geographies with each of these datasets, you can view these trends at a more granular level. Looking at Predominant Race/Ethnicity in Chicago area Census Tracts in the map below, observe that many neighborhoods in the western and southern areas of Cook County are predominantly Non-Hispanic Black, and many neighborhoods in Southwest Cook County are predominantly Hispanic.
As always, our datasets are better together! Layering this data with point locations like libraries, nonprofits, school, hospitals, or grocery stores will allow you to make comparisons and learn more about trends in your neighborhood and across the nation.
About This Dataset
The Diversity Index shows the probability that two individuals, chosen completely at random would be of different races or ethnicities. Lower values indicate less diversity, while higher values, especially those over 50 indicate more diversity. The Predominant Race/Ethnicity and Predominant Race indicators show what Racial or Ethnic groups are predominant in any given area and what percentage of the population that group makes up. Both datasets also include indicators that show specifically what Racial or Ethnic groups make up 50% or more of the population. The Predominant Race/Ethnicity data is calculated using 7 non-overlapping Racial categories along with the Ethnic category Hispanic. The Predominant Race data is calculated using the 7 non-overlapping Racial categories.