
What Makes a Resilient City?
Data
Baseline Resilience Indicators for Communities (BRIC)
Source
Find on PolicyMap
- Quality of Life
- Disaster Risk
- Resilience
- Overall Resilience
- Social Resilience
- Economic Resilience
- Infrastructural Resilience
- Community Capital Resilience
- Institutional Resilience
- Environmental Resilience
The U.S. National Academy of Science defines disaster resilience as “the ability to prepare and plan for, absorb, recover from, and more successfully adapt to adverse events.” Disaster resilience is becoming increasingly important as the climate changes, and data tools like the Baseline Resilience Indicators for Communities (BRIC) index can provide a starting point for building communities that are more resilient to natural hazards.
BRIC was developed by the Hazards and Vulnerability Research Institute at the University of South Carolina. It models community resilience to natural hazards by considering six categories of disaster resilience: social, economic, infrastructural, community capital, institutional, and environmental. Counties receive a resilience score for each category, as well as an overall resilience score. So, for example, if a county is very socially resilient, but less economically resilient, this would be represented in the data. Each category’s score ranges from zero to one, with one being more resilient.
A common first step in improving disaster resilience is to organize local committees in an effort to identify aspects of resilience most lacking within a given community. The BRIC data’s resilience scores can help by providing an overview of various aspects of resilience in a community.
Resilience scores can be paired with community-specific data and observations to efficiently and systematically generate community-specific plans for increasing resilience. Resilience scores can also be monitored to compare changes in resilience over time or across different areas.
Resilience in Greater Houston
The map below shows the overall resilience for nine counties in the Greater Houston metro area: Austin, Waller, Montgomery, Liberty, Chambers, Galveston, Brazoria, Fort Bend, and Harris.
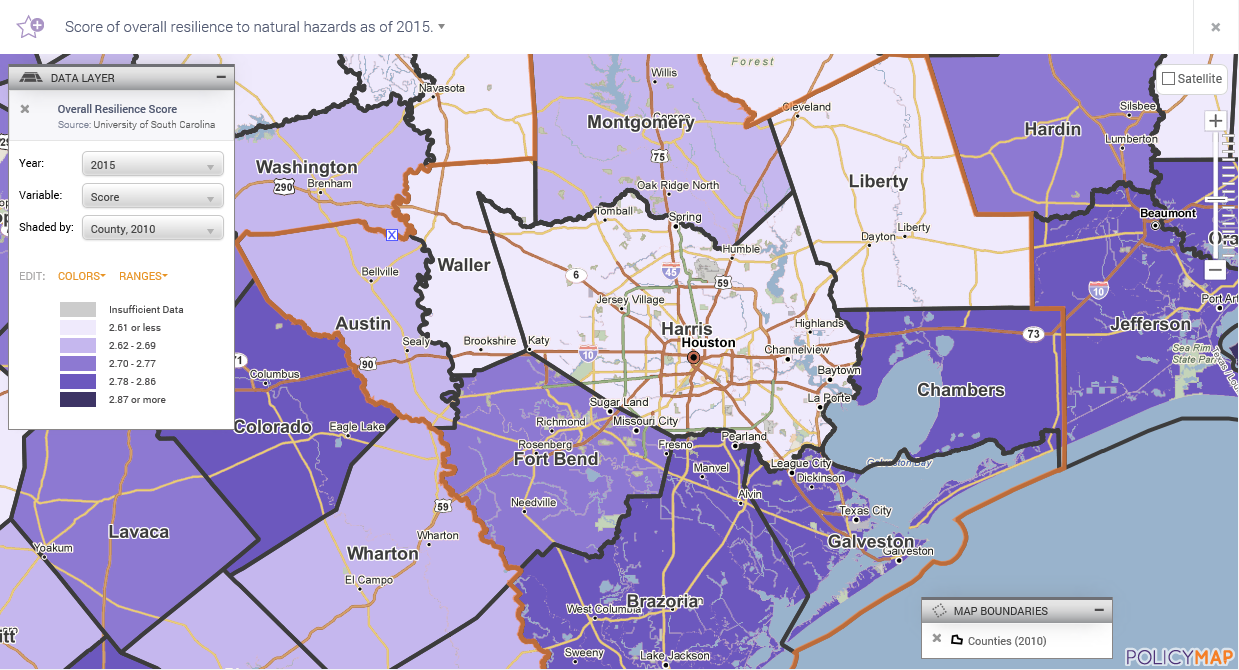
The map shows that overall resilience is lowest in Harris, Liberty, and Waller Counties, but overall resilience scores alone only tell part of the story. A given community might have particular strengths to build off of, or weaknesses that need to be addressed.
To identify real-world community characteristics that might be contributing to a community’s overall resilience score, BRIC’s category scores can help identify specific areas of strengths and weaknesses. These scores can then be dissected further by looking into their contributing variables using other data on PolicyMap. Moreover, local data can be incorporated to provide community-specific context.
Social Resilience
Social resilience provides an indicator of the physical and mental wellness of a community’s residents, which is associated with increased comprehension, communication, and mobility, all important when responding to a disaster. Communities that have high levels of educational attainment, fewer retirees, more English-speakers, higher rates of health insurance, more households with telephone service, and more access to mental and physical health resources are likely to have higher social resilience.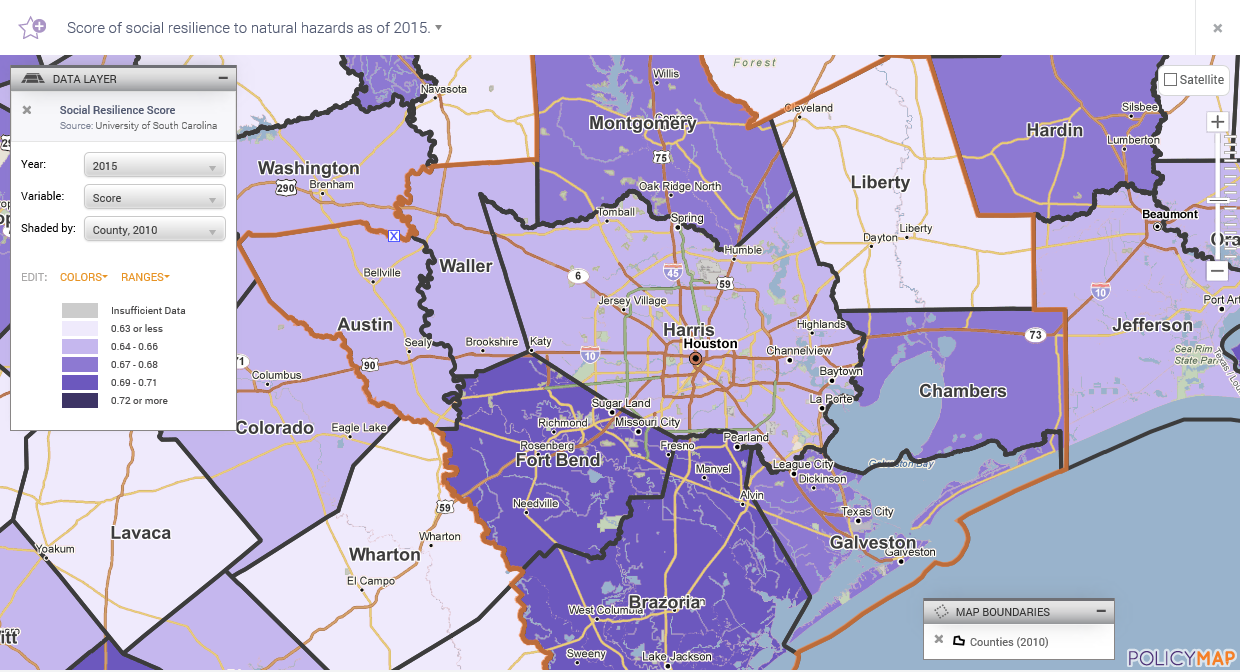
Social resilience is lowest in Liberty, Harris, and Walker Counties. Like many components of resilience, there are aspects of social resilience that are endemic to the place, like residents’ ages and disabilities, and some aspects that policymakers can take steps to improve, like telephone service and access to mental and physical health resources.
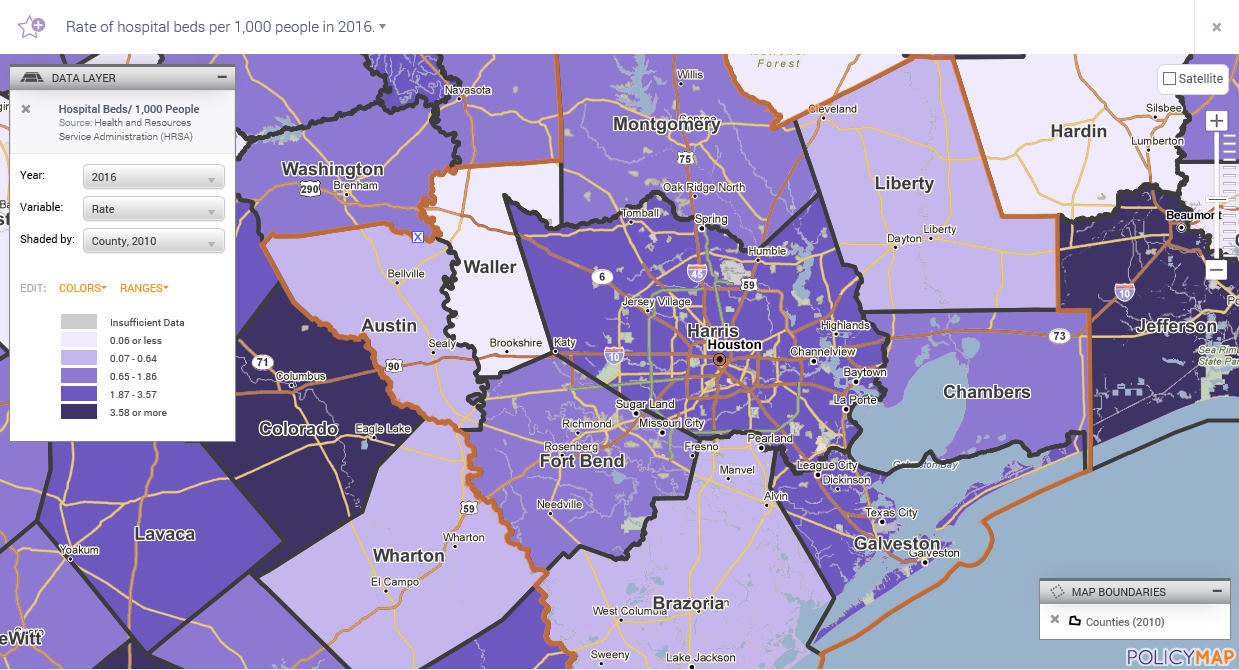
Other data can help policymakers determine which aspects of resilience contribute most to resilience in a particular county. For example, to investigate the influence of access to mental and physical health resources on social resilience, data on the rate of hospital beds per 1,000 people in Greater Houston could be incorporated. Harris County has a relatively high rate of hospital capacity, unlike Liberty and Waller County. This could indicate that low social resilience in Harris County is more heavily influenced by endemic aspects of social resilience (like age and disability).
Infrastructural Resilience
Infrastructural resilience considers quality of housing construction and infrastructural capacity to facilitate disaster-related operations such as evacuations and emergency medical care. Communities with more public schools, higher access to broadband internet service, more hospital beds, and newer housing are likely to have higher infrastructural resilience.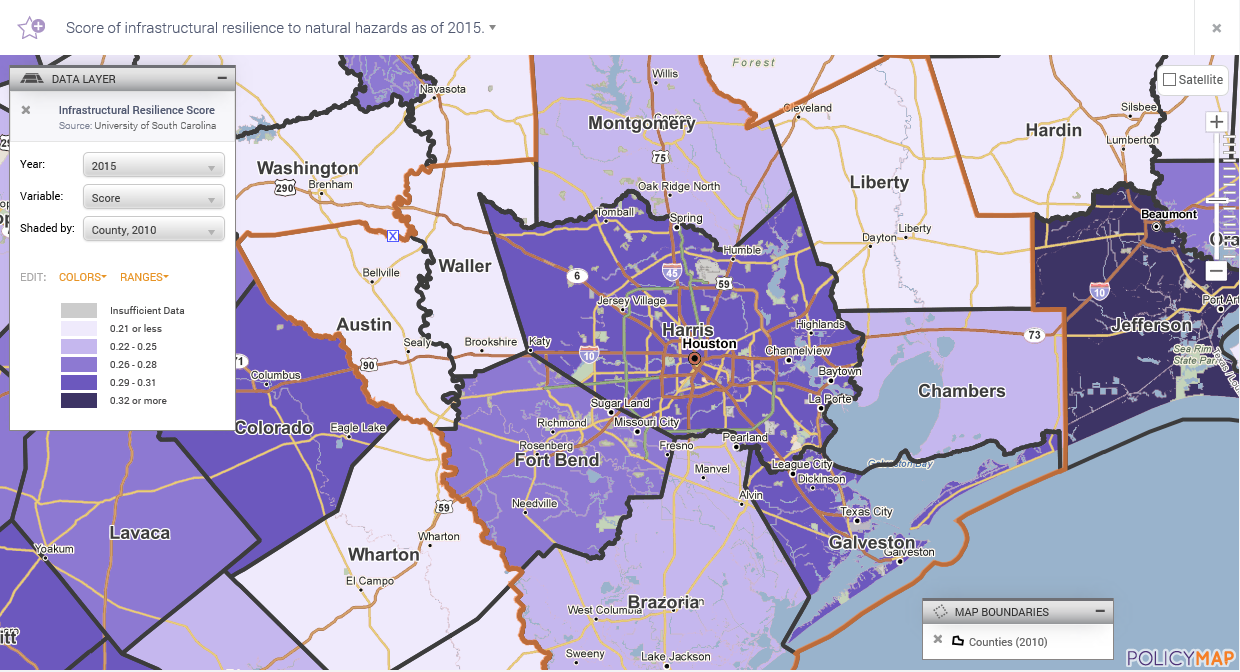
High resilience in one category could be diminished by low resilience in another category. Harris County has the highest infrastructural resilience score in Greater Houston, despite having a low overall level of resilience. So, Harris County is likely to have high access to broadband internet service and more hospital beds, but these factors would have limited benefit due to non-infrastructural factors like a lack of health insurance and English-speaking ability.
Environmental Resilience
Environmental resilience considers qualities that mitigate the effects of coastal surges and freshwater flooding. Communities with more wetlands, more pervious surfaces (meaning, less asphalt), and lower energy consumption are likely to have high environmental resilience. The map below shows environmental resilience in Greater Houston with an overlay of FEMA flood risk.
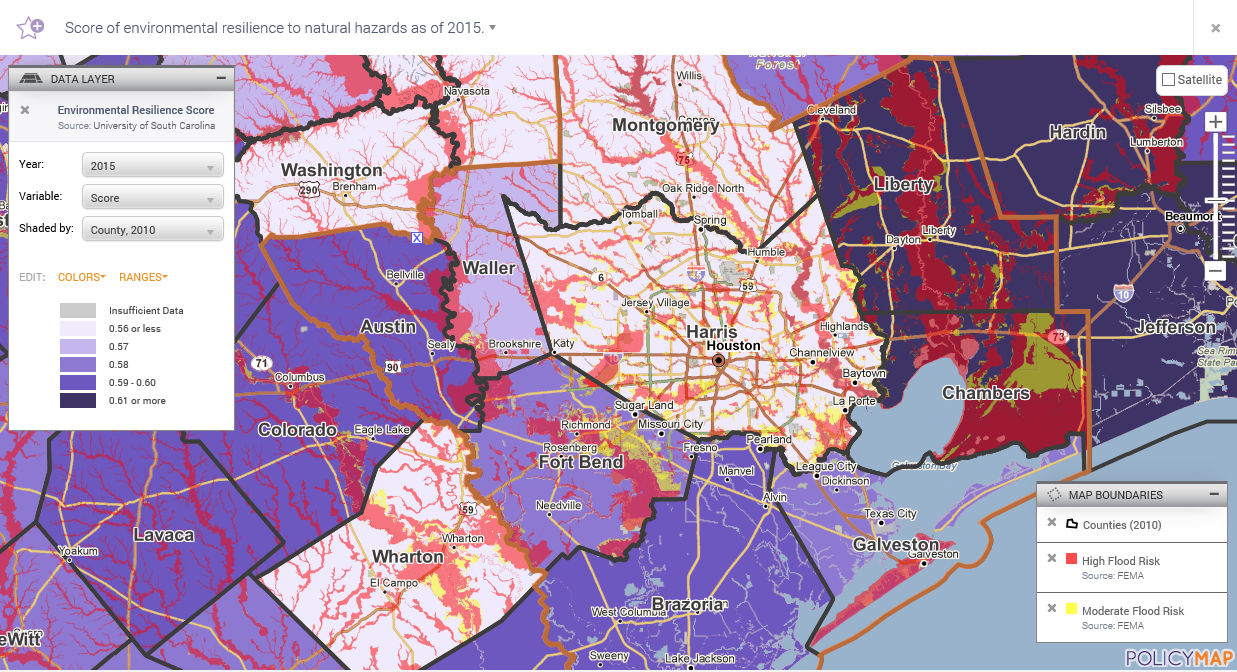
Low resilience in one category could necessitate action in another category of resilience. For example, aspects of environmental resilience such as pervious land cover and percentage of wetlands can help mitigate the effects of a flooding event but improving these aspects could be difficult in highly populated areas such as Harris County. Policymakers might prepare for the higher intensity of flooding in Harris County by improving evacuations and emergency medical care (reflected by infrastructural resilience), rather than increasing pervious surfaces and wetlands.
Community Capital Resilience
Community capital resilience considers the preparedness and inclination of local citizens to assist their fellow citizens. Communities with a higher percentage of participating voters, more civic organizations, and more Red Cross volunteers are likely to have high community capital resilience.
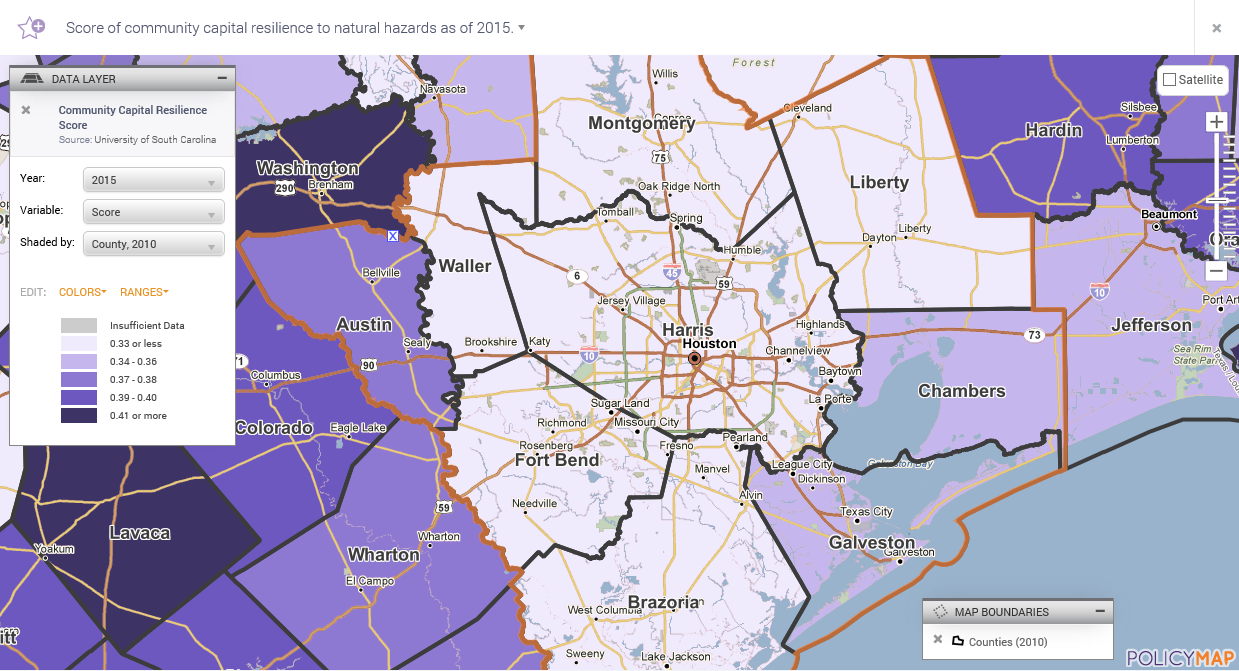
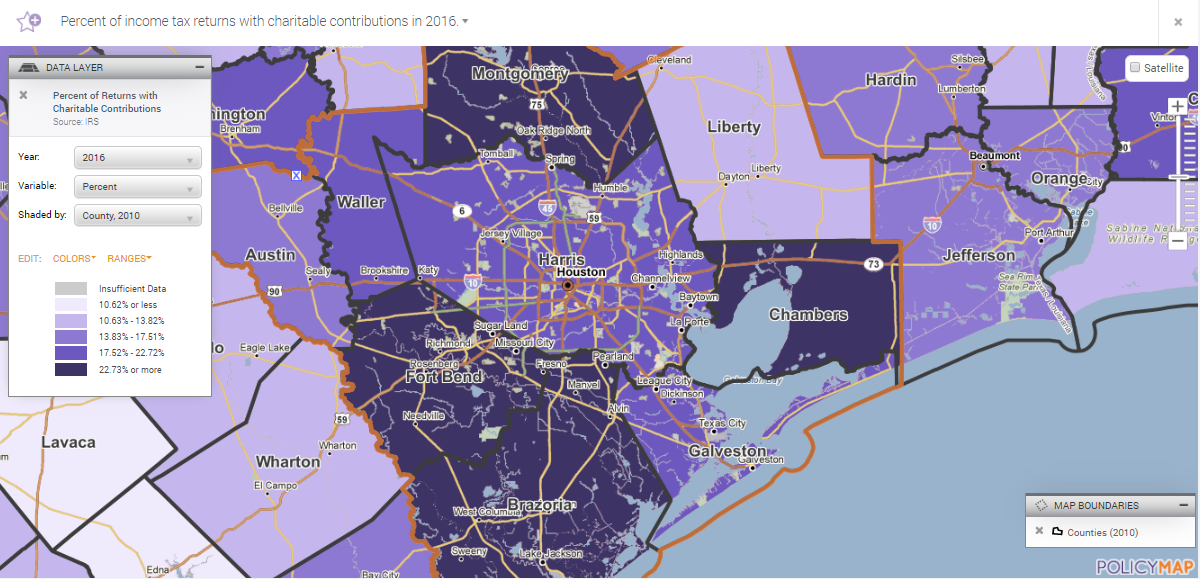
Category variables are not always comprehensive, but they can be supplemented with data from other sources. For example, community capital resilience remains relatively constant in Greater Houston. To get a better idea of how community capital resilience varies, policymakers may include data on the percent of people who donate money to charity, as an indicator of their commitment to their community. This data is available from the IRS, though it’s worth keeping in mind that generally only higher-income earners deduct charitable contributions on their taxes. Still, it’s one of various datasets that can help provide a complete picture.
Economic Resilience and Institutional Resilience
Economic resilience considers community economic vitality, diversity, and equality in compensation. Communities with more owner-occupied housing units, more large businesses, a smaller income gap, and more federal employees are likely to have high economic resilience.
Institutional resilience considers programs, policies, number of jurisdictions, and proximity of communities to seats of political and economic power. Communities with more houses covered by the National Flood Insurance Program, more Presidential Disaster Declarations, more crop insurance coverage, and higher spending on mitigation projects are likely to have high institutional resilience.
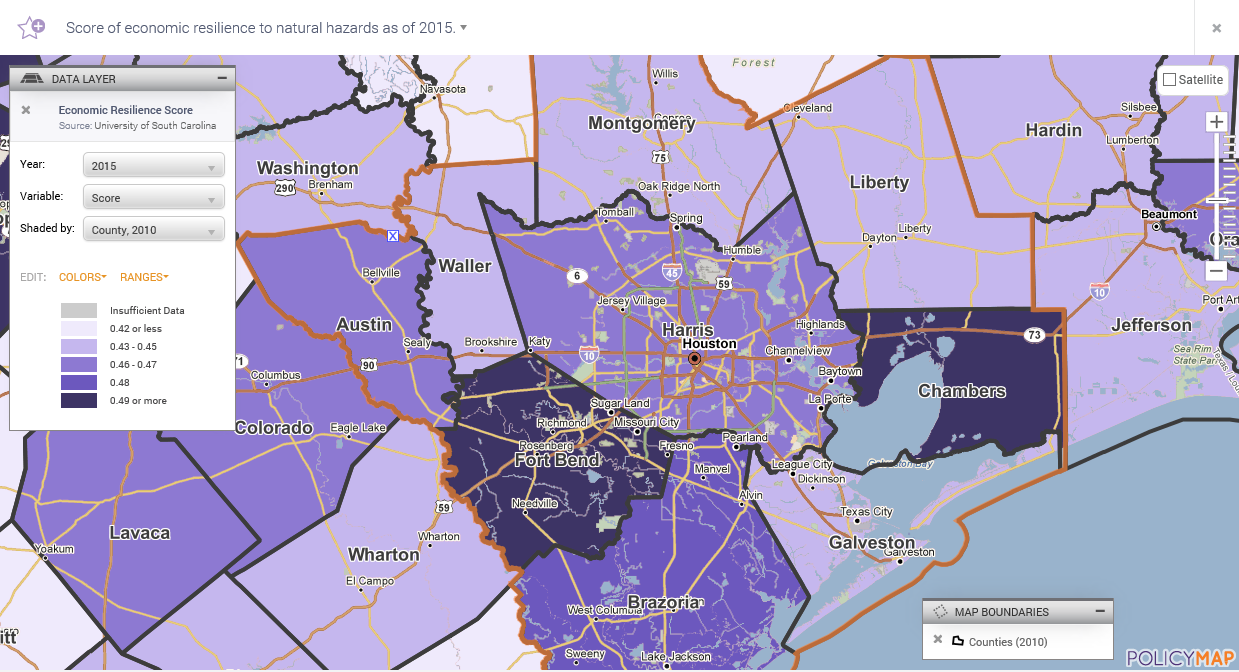
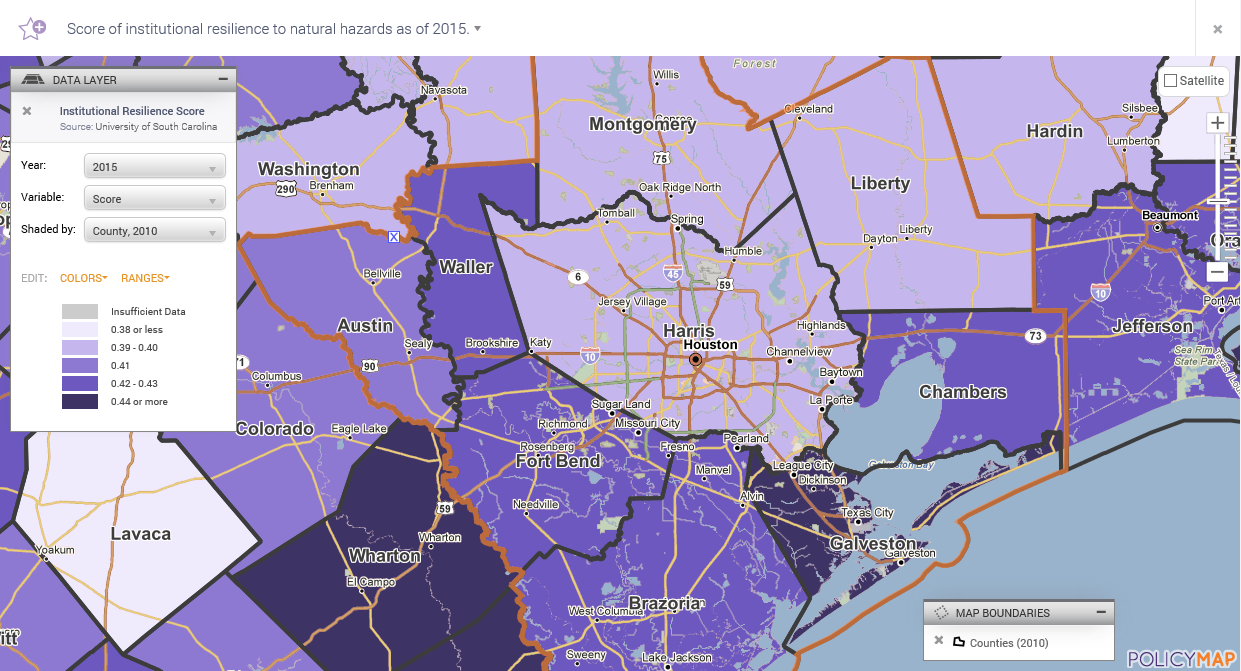
All counties in the Greater Houston Metro Area have relatively high economic resilience, especially Chambers and Fort Bend. To preserve economic vitality in these areas, policymakers might want to ensure that they have sufficient coverage by the National Flood Insurance Program and mitigation spending (variables for institutional resilience).
The risks of disasters are a reality that every community needs to deal with in some form. But with the right amount of preparation and forethought, they don’t always need to be devastating to a community. Data like BRIC can help communities identify their strengths and weaknesses and be ready to respond when disaster does strike.
BRIC data is available to all users, and is accessible in the Quality of Life menu, under “Disaster Risk” and “Resilience”.