
What’s Trending in Mortgage Lending for 2014?
The Home Mortgage Disclosure Act (HMDA) requires that lenders report every mortgage application and origination annually, along with applicant demographics and income. This data source provides crucial information on the status of the housing market. We’ve recently updated these data to 2014; all HMDA indicators are available to all PolicyMap users in the Lending tab, with detail down to the census tract.
From 2012 to 2014, the number of mortgage originations of all types declined by more than 40 percent nationwide, driven by a sharp decrease (-67%) in the number of refinance loans. Home purchase lending continued its gradual trend upward, increasing 20 percent over the two years; this is still far from the peak. There are only 89 counties where the percent change in refinance originations between 2012 and 2014 is positive; many of these are rural counties just east of the Rockies, as well as Alaska and West Virginia.
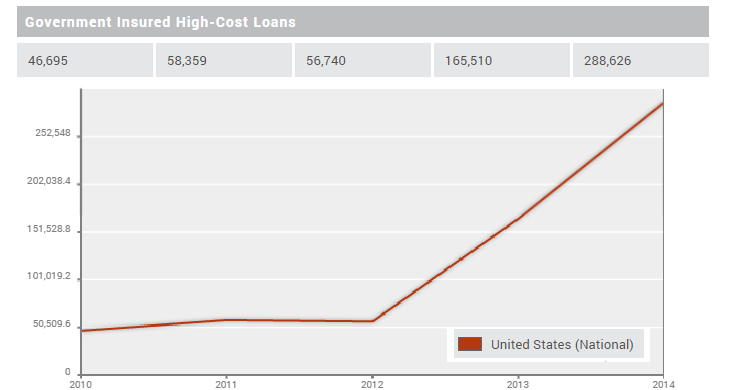
Another big change has to do with mortgages backed by the Federal Housing Administration (FHA)-backed mortgages. The number of FHA loans has declined sharply since 2008, in part driven by the introduction of less-favorable mortgage insurance premiums (MIP). However, the number of high-cost government-backed loans has also increased dramatically since 2013. High-cost loans are those with a rate spread, or a difference between the loan’s APR and the annual prime offered rate (APOR). According to the Federal Reserve, “Increases in the FHA’s MIP and the term length over which it must be paid appear to have pushed many FHA home-purchase loans just over the reporting threshold.” (pdf) Because all FHA loans were affected by higher MIPs, the trend is quite notable. (The definition of high-cost changed in 2009 so one should use caution when comparing high-cost lending over the full period in the data).
We’ve also updated our HMDA Report so you can easily compare lending trends across time. This report is available to subscribers. Note that HMDA data uses 2000 Census boundaries until 2011, and 2010 boundaries beginning in 2012. Metropolitan areas (CBSAs and Metro Divisions) use the 2013 definitions for 2014 data, and the 2003 definitions for prior years. Phew!!