
Special Edition: COVID-19
Access important data related to the pandemic with PolicyMap
UPDATE: As of 05/10/2023, PolicyMap has retired the publicly-available COVID-19 tool. Data related to COVID-19 is still available through PolicyMap. If you are interested in COVID-19 data or other health data, please contact us.
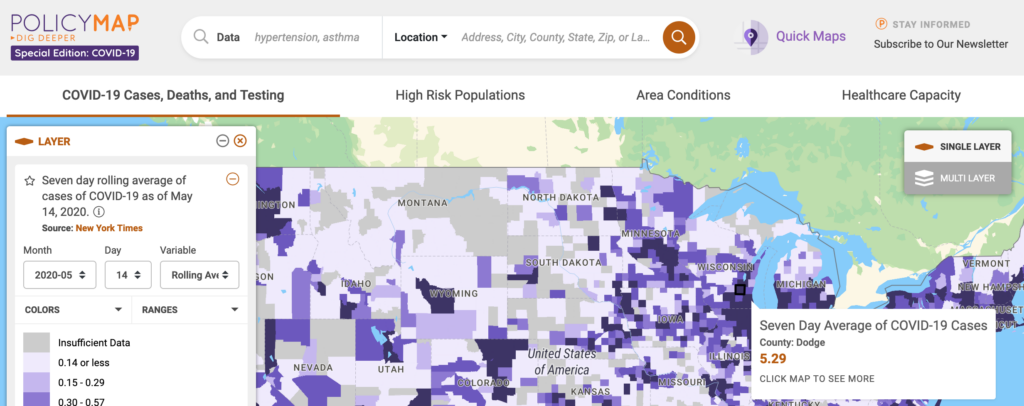
PolicyMap COVID-19 Quick Maps
We are releasing a publicly available (beta) application focused on answering crucial questions faced by communities dealing with the COVID-19 virus.
NEWS COVERAGE
Where Chronic Health Conditions and Coronavirus Could Collide
In an article titled “Where Chronic Health Conditions and Coronavirus Could Collide,” the New York Times worked with PolicyMap to develop an index of health risk to severe COVID-19 illness. The New York Times interactive assigns a severe coronavirus risk designation for every county in the US.
DATA DOWNLOAD
Download: PolicyMap Severe COVID-19 Health Risk Index
Download and access our index of health risk to severe COVID-19 illness. The index identifies counties with high rates of the underlying conditions that increase residents’ risk of becoming severely ill if they are infected with the coronavirus.
COVID-19 Quick Maps
COVID-19 Mortality Risk
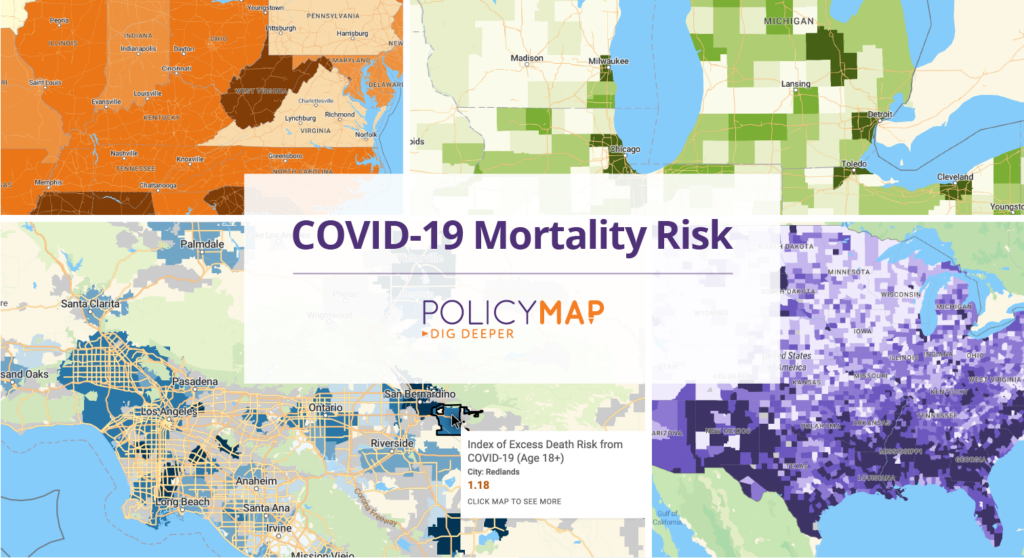
PolicyMap has released a new mapping tool, COVID-19 Risk Maps, to help policymakers identify populations at highest risk of death due to COVID-19. The tool uses data from researchers at Johns Hopkins Bloomberg School of Public Health that is part of their COVID-19 Mortality Risk Calculator.

Read more on our blog.

Watch a presentation by Bloomberg Distinguished Professor Nilanjan Chatterjee about the research.

View the article published in Nature Medicine.

Read the press release from Johns Hopkins Bloomberg School of Public Health.
NEWS COVERAGE
How the Coronavirus Exposed Health Disparities in Communities of Color
The Washington Post used PolicyMap data to analyze how COVID-19 magnifies existing health disparities in communities of color.

See What PolicyMap Can Do For Your Organization.
Get in touch with the team to:
- Access clean, standardized, and always up-to-date data on health and the pandemic
- Download PolicyMap’s “Severe COVID-19 Health Risk Index”
- Learn more about our mapping application, analytics platform, and data licensing.
COVID-19 Blog Posts


Customer Stories
Learn how our customers use PolicyMap to address the pandemic and other community health issues.
City of Lancaster, PA: COVID-19 PSA Mural Project
The City of Lancaster, PA employed local artists to address the hazards of COVID-19 through public murals. To make the greatest impact, the City needed to know how to reach those residents most vulnerable to the virus. Using PolicyMap’s data, maps, and expertise, the Lancaster Public Art department identified seven criteria to inform siting of their public service announcement (PSA) murals about social distancing, mask wearing, and mental health.
Quantum Foundation and the City of Delray Beach
PolicyMap customer Quantum Foundation and the City of Delray Beach teamed up to provide COVID-19 testing amid health equity concerns through Foundcare, a nonprofit Federally Qualified Health Center. The Quantum Foundation identified testing needs by examining PolicyMap data on co-morbidities, underlying health conditions and older age populations.
Northwell Health
PolicyMap customer Northwell Health uses PolicyMap to identify underlying causes of health disparities at the neighborhood level. By building their own Patient Risk Score and Social Vulnerability Index using patient level data with aggregated community indices, Northwell Health will “flip the lens” from the traditional individual patient care focus to a more holistic community view.

First Book: COVID-19 Activation Network
In order to understand the impact that COVID-19 is having on their national network of educators and other organizations that serve children in need, First Book worked with PolicyMap to map their COVID-19 Activation Network. Based on an ongoing survey of First Book members, this map shows educators and organizations that are looking for books and other resources to provide to children so that they can continue their education from home.

I-DIEM (Institute for Diversity and Inclusion in Emergency Management)
PolicyMap presented at I-DIEM COVID-19 virtual convening to identify minority populations and areas that may not be adequately served through responses to the COVID-19 pandemic. I-DIEM, the Institute for Diversity and Inclusion in Emergency Management, is a resource and advocate for diversity and inclusion in Emergency Management Missions. I-DIEM shares PolicyMap’s dedication to provide data resources to better operationalize equity in emergency management during the pandemic and beyond.

Columbia University – Built Environment and Health Research Group
Relying on PolicyMap, researchers at Columbia University use PolicyMap to identify populations at risk for developing severe COVID-19 in a two-part series. Part I features PolicyMap data to detect various at-risk groups, and Part II reveals their risk analysis of vulnerable populations layered with hospital bed capacity.
Examine your community’s risk with Columbia University’s online PolicyMap tool.