
2006-2010 American Community Survey (ACS) Data Available
The 2006-2010 American Community Survey (ACS) data is now available for free on PolicyMap! In addition to a number of updated indicators throughout the Demographics, Education, Neighborhood Conditions, Real Estate Analysis, Money & Income, and Owners & Renters tabs, this ACS update also includes several new indicators never before on PolicyMap! New indicators include the number and percent of families (and working families) receiving Supplemental Nutrition Assistance Program (SNAP) benefits (previously called food stamps), which can be found at the bottom of the Money & Income tab.
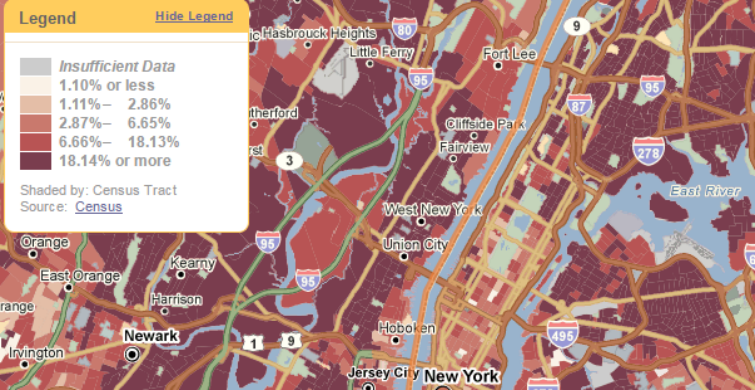
There are also a few exciting new Demographics indicators related to the language people speak in their homes. The map below shows the percent of people for whom Spanish is the language most often spoken at home in the NYC/Northern NJ area, with the darkest red representing census tracts where more than half the population speaks primarily Spanish at home!
Data is also available for the number and percent of people who are non-English speaking. The map below displays how non-English speakers in the Seattle area are most densely located in the southeastern parts of the metro region.
The 2006-2010 ACS data is currently being shown on PolicyMap at the 2000 Census boundaries. Users may notice that for some areas, the ACS data displays as having “Insufficient Data.” This is because, in order to show the data at the 2000 boundaries, we suppressed data in geographies where there was a significant change between the 2000 and 2010 vintages. In early 2013, however, PolicyMap will be transitioning to the 2010 boundaries. We are hard at work on a system-wide platform upgrade that will allow users to move easily from one vintage to the next and compare them simply and accurately over time. We are very excited about this upgrade and will be sure to let users know when it is ready for action!
It is also important to note that while the 2006-2010 ACS data has replaced the 2005-2009 ACS data for all indicators on the Maps page, all PolicyMap reports (such as the Community Profile Report) continue to generate with the 2005-2009 ACS data. Once the upgrade has been completed and data can be viewed at the 2010 boundaries, the reports will once again generate the most recently available ACS data.
And lastly, keep an eye out for the 2007-2011 ACS data, as that will be available on PolicyMap shortly!