
UPDATED: Announcing the PolicyMap Community Health Report
Update (3/21/2019): Significant health disparities can exist within a city. Neighborhoods separated by miles can be separated by worlds in terms of socioeconomic conditions, health resources, and outcomes. Often, addressing a city or county’s health conditions means addressing the specific conditions of certain neighborhoods.
To better assess local health conditions, the PolicyMap Community Health Reports can now be created for census tracts, in addition to counties. Census tracts are about the size of neighborhoods in cities, and towns in more rural areas. Data from a wide range of sources is available at this local geography, making it easier to understand and address local health issues.
Census tract reports can be created either by entering the census tract FIPS code into the Reports page, or by opening a map with census tract data from the maps page, clicking on a tract, and choosing “Get Report” from the bubble.
Original post: Place matters when it comes to health. Where someone is born and where they live can be the most significant factors in their overall well-being. This can be due to demographic and economic conditions in an area, access to medical services, access to resources like healthy food and affordable housing, and the local environment.
To help people and organizations understand the health landscapes and healthcare needs of communities across the U.S., PolicyMap has created a new report on Community Health available to premium subscribers and most enterprise and academic licenses. Check out a sample PDF here.
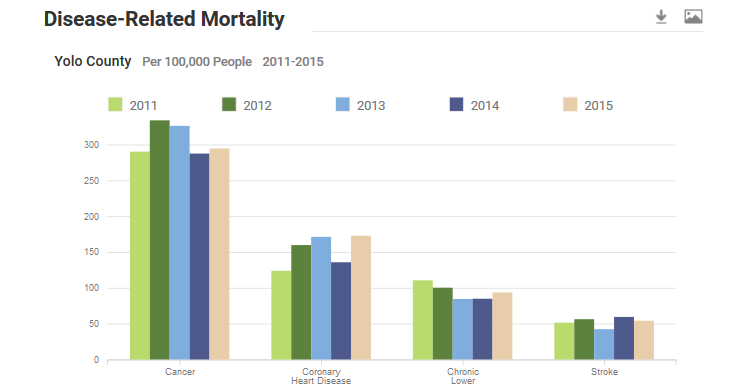
The report provides a snapshot of the population, as well as a summary of healthcare access, health behaviors, general health, morbidity, mortality, food security, and social determinants of health in the area. It answers questions like:
- Does this area have sufficient doctors, dentists, and facilities for its population?
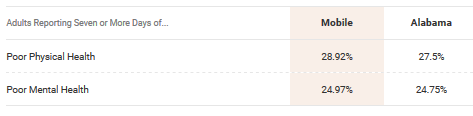
- What risky and healthy behavior do people here engage in?
- How many people suffer from chronic conditions like high blood pressure and high cholesterol?
- What’s the average income level and how prevalent is poverty?
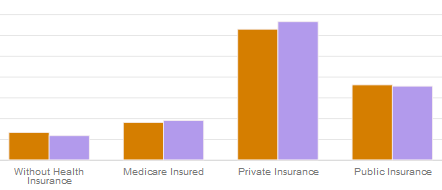
It’s a ton of information, but neatly organized with simple to interpret charts and tables. Each section of data can be easily downloaded, either as an image, or a CSV with the data.
Although the report is useful to anyone looking at health conditions, it may be of particular use for Community Health Needs Assessments (CHNAs), which community hospitals are required to complete. The report was designed with CHNAs in mind, and contains much of the data they require. That said, the report is also instrumental to students and researchers requiring quick data downloads for specific healthcare-related topics.
We’ve released this report for any county in the U.S. We will continue to add functionality to the report, first with other geographies, like ZIP Codes and census tracts, and later with custom geographies you draw yourself. We’re also planning to add new data concerning air quality and water safety.
In developing the report, we consulted with health data users and experts, many of whom had requested such a report. We looked over similar healthcare reports around the web, and looked into what additional information might be useful, based on what we were hearing.
Additionally, we reviewed numerous online CHNA assistance tools, spoke with healthcare administrators, studied resources such as Metrics for Healthy Communities, reviewed individual hospitals’ CHNAs, and spoke with our colleagues at Philadelphia Health Management Corporation and at the School of Health and Medical Sciences at Seton Hall University.
After hearing from all these different entities, the challenge was then to choose what data was most useful and pertinent. If there’s anything not in this report that you’d like to see, please let us know!
For more information about a PolicyMap premium subscription or enterprise or academic license, visit https://www.policymap.com/pricing/.