Census 2010 Data on Census 2000 Maps; How We Do It

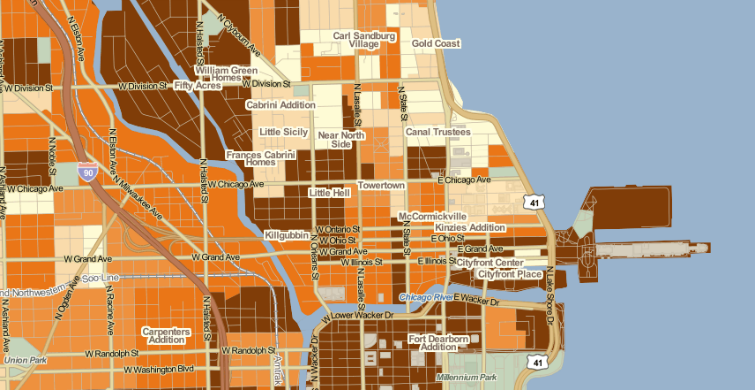
You may have noticed that, in your neighborhood on PolicyMap, the Census 2010 data show a few (or more than a few) block groups and Census tracts as grey and having “Insufficient Data.” This isn’t because the Census missed these places or because we don’t think they’re important! It’s because, for now, we’re showing the Census 2010 data on Census 2000 maps. And because of population changes between 2000 and 2010 (which the Census is designed to identify), many block groups have been redrawn by the Census.
What we’ve done to account for these changes is to create a bridge table that we think allows us to show most accurately the 2010 data on our 2000 maps. The bridge was created by looking at where 2000 and 2010 Census block boundaries overlapped. For example, if a given Census 2010 block overlapped two separate 2000 block groups, we allocated a percentage of Census 2010’s population proportionately to each of the 2000 block groups. The percentage we used to create the 2010 Census block group data on PolicyMap was calculated based on the area of the 2010 Census block that was in each block group. The bridge table does not include small slivers of area that represent less than 10% of the Census block area.
For Census tracts and counties that have split, merged, or otherwise significantly changed from 2000 to 2010, we don’t use a bridge table, however. We show these 2010 data as simply having “Insufficient Data.”
Why do we do this? It’s because we can currently only show one map vintage at a time on PolicyMap. We’re working to remedy that, though, just in time for the 2006-2010 American Community Survey data release in December.
But before that, we’re looking forward to the full release of the Census 2010 Summary File 1 this month! We’ll let you know once it’s available from the Census and it has replaced the Redistricting Data currently on PolicyMap.