
Did you know… (Embed Maps)
Welcome to our series on helpful tips for PolicyMap. With over 10,000 data indicators and many online features, we hope our series can help users better utilize PolicyMap. For a complete training, please join a free online session here: Click Here
Did you know that subscribers have a new and dynamic way to share maps on PolicyMap? We’ve recently added the Embed Map feature. An embed map is an interactive map that is displayed on your website, or any website, which a user can pan or zoom within the map.
What is an embedded map and how can you use them? Embed Maps are interactive maps that you can place on your website, allowing your visitors to navigate around the map and click an area or address for more information. Try out the map below, pan around the area or click onto a place or icon:
Embed Maps are delivered as an “iframe code” so the HTML for the above map would look like this;
<div style=”text-align:center”>
<iframe src=”/embedmap_dyn?lqid=169709″ named=”embeddedmap” scrolling=”no” marginheight=”0″ marginwidth=”0″ frameborder=”0″ width=”640″ height=”450″ >Click here to interact with map.</iframe>
<div style=”font:13px arial,geneva,helvetica,sans-serif”>Data mapped by <a style=”text-decoration:underline” target=”_blank” href=”/”>PolicyMap</a>, an online GIS mapping tool.</div></div>
If you have the ability to publish on your website, simply add the iframe code generated in PolicyMap, publish, and now you have a fully interactive and informative map.
How to use the Embed Map tool
-
- Log into your account. The Embed Map feature is available to all users.
- Setup the map, just like you would setup to print a map;– Use the search bar to zoom to a location– Add a data layer and data points– Customize the data using the legend; edits ranges, change colors, or filter points– Add or remove map boundaries
- Select the Embed icon in the upper right corner

-
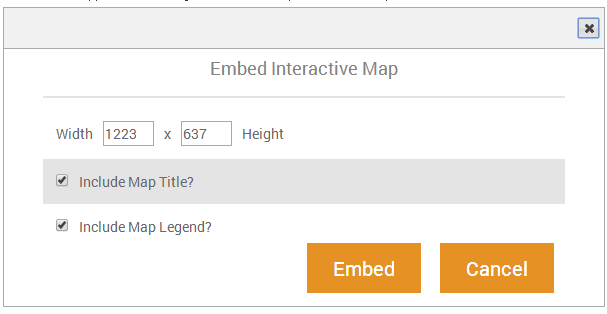
- A window will appear which will give users some options for the map;
 – Set the dimensions to the map area. This should be based on the available area the map will display on– Select to include a Map Title. This will display the data layer title and also the “details” button that contains a lengthier description of the data layer– Select to include a Legend. For Data Layers, this will show the data provider and ranges for each color. For Data Points, this will display the icon for the dataset as well as any filters or color codes
 - Select Embed and the iframe code will appear. Copy the code and paste it onto your website
- A window will appear which will give users some options for the map;

Don’t be too afraid if you’re not familiar with HTML or code. All you need to do is copy and then paste the text onto your blog, website, or discussion forum to share a map.
Here are some examples on the PolicyMap blog (www.policymap.com/blog):
- www.policymap.com/blog/2010/08/a-closer-look-cra-eligible-tracts-and-tract-median-family-income/
- www.policymap.com/blog/2010/06/a-closer-look-percent-of-votes-for-democrat-barack-obama-in-the-2008-presidential-general-election/
- www.policymap.com/blog/2010/08/top-10-falling-home-sales-between-2008-to-2009/
For more information, contact our support team at pmap@policymap.com or join our free online trainings available on our calendar here.
Sincerely,
The PolicyMap Team
![]()