
Home sale data for 2013 now available on PolicyMap!
Update (06/09/2021): PolicyMap now has home sale data from Moody’s Analytics. Read more here.
PolicyMap recently updated our home sale data to include 2013 transactions. The data include information on how many home sales occurred in your neighborhood, city or county. It also includes the median sales price of those transactions, and the loan-to-value ratio, which compares the value of the first mortgage taken out on a home to the sales price.
Our home sale data is one of the most popular datasets we have because these statistics are so important to understanding the real estate market in an area. Annual data are available from 2006 through 2013, but we also offer a 5-year trend indicator that allows you to look at trends in home sales from 2001 to 2006.
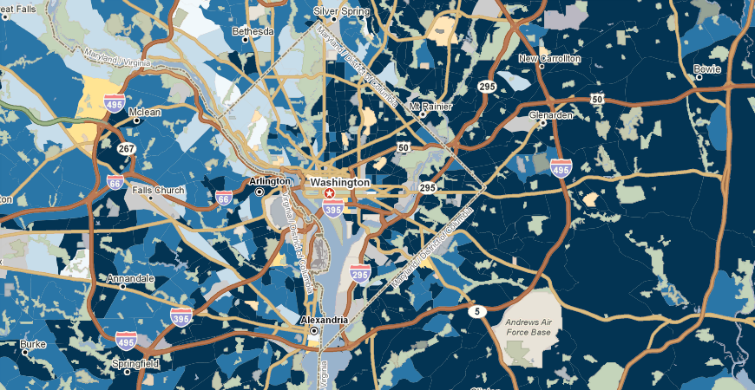
The two maps below compare the 5-year trends in home sale prices in the Washington D.C. Metropolitan area. The first shows the percent change in the median sales from 2001 to 2006. The areas on the map that are darker purple indicate that sales prices have gone up the most – more than a 125% increase in five years. The lighter purple areas on the map also saw increases in sales prices but at lower rates. The pattern in fairly clear; greater sales price increases occurred in the eastern half of Washington DC, in Prince George’s County Maryland (to the east of the City), and some parts south and west of D.C. This next map shows the percent change in sales prices in the D.C. area between 2008 and 2013. As you can see, the housing boom, crisis, and recovery have hit different parts of the D.C. Metropolitan Area in different ways. In this map, the dark purple still indicates areas with the fastest growth in prices, but on this map these are areas where the percent growth in prices exceeded 11% only. The areas in orange on the map indicate declines in home sale prices over the last 5 years, exceeding a 27% reduction in price in the darkest orange shades. As you can see, Prince George’s County Maryland (east of D.C) experienced some of the fastest growth in sales prices from 2001-1006, but also the greatest declines in prices in the last 5 years!
 Our home sale data is only available to PolicyMap subscribers. To check out home sales in your area, sign up for a free 7-day trial. And for more information about this dataset please see our data directory.