
How to Customize a PolicyMap Widget
Update:
- (06/01/20) Updated to reflect new widget and embed map options
- (10/25/13) Changing the location a widget is defaulted by CBSA
- (01/01/13) Changing the location a widget is defaulted by state, county, or city
- (01/12/11) Set Location bar is now dynamic depending on the width of the embed map or widget
- (02/03/11) Rankings in a widget now has the option to print
- (10/14/11) Alternative widget layout
What is a widget? Widgets are customizable instances of PolicyMap maps with dynamic features such as the ability to zoom into or pan across a map, click on an area to view the underlying data or toggle between additional data layers and points of data.
Each widget is completely customized to our users’ needs. Users can decide the default location, type of datasets to display, and boundaries to overlay. Within the URL of the PolicyMap widget, there are commands which allow some basic customization of the widget, and outside the URL are customizations for the frame of the widget. Some of these customizations are only available if the widget was originally designed to have the feature.
What is an embed map? Embed Maps are similar to widgets but contain one data layer and point dataset and does not have a location search option. Embed Maps are available to all logged in users under the Share feature.
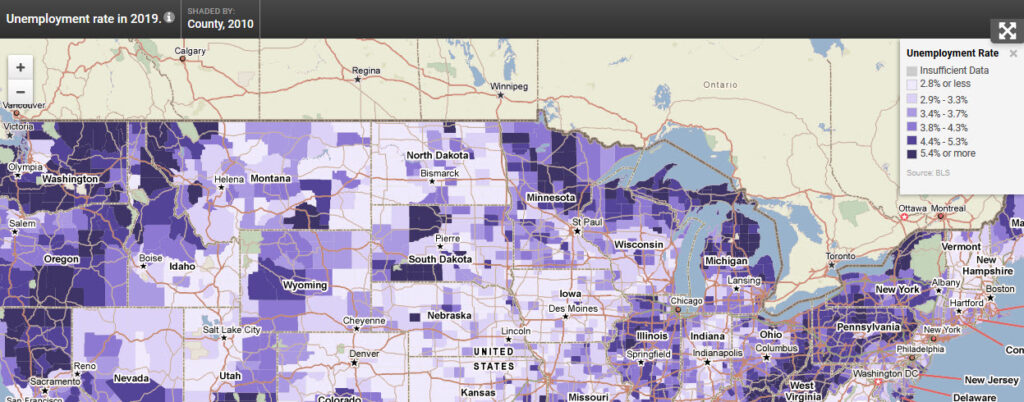
We will use the free Unemployment Widget offered by PolicyMap (www.policymap.com/blog/?p=3395) to demonstrate the options to edit the widget.
<div style=”text-align:center”>
<iframe src="https://www.policymap.com/widget?sid=28&wkey=87DE56DB6494C4F622DDB88F042B4DD9" width="100%" height="700" scrolling="no" marginwidth="0" marginheight="0" frameborder="0" name="PolicyMap"></iframe>
<div style="font:13px arial,geneva,helvetica,sans-serif">Data mapped by <a style="text-decoration:underline" target="_blank" href="http://www.policymap.com">PolicyMap</a>, an online GIS mapping tool.</div></div>
Adding HTML within the <iframe …> </iframe> but outside the URL will customize the framework which contains the map (see highlighted area below). These customization are similar to HTML options.
![]()
- width=”value/px” – The width of the frame that contains the widget. Values can be in percentages or pixels (Note: the “width=” should be greater than the “&ew” inside the URL)
- height=”value/px” – The height of the frame that contains the widget. Values can be in percentages or pixels (Note: the “height=” should be greater than the “&eh” inside the URL)
- scrolling=”value” – Choose yes or no to add vertical and horizontal scroll bars around the widget
- marginwidth=”0″ – Side margins between the map and frame
- marginheight=”0″ – Top and bottom margins between the map and frame
- frameborder=”0″ – You can add a border around the entire frame
- name=”PolicyMap” – Give a widget a customized title
Now adding HTML within the <iframe …> </iframe> to the URL (see highlighted area below) will customize the widget/embed map interface. Any customization in the URL is changing how the map looks and interacts.
![]()
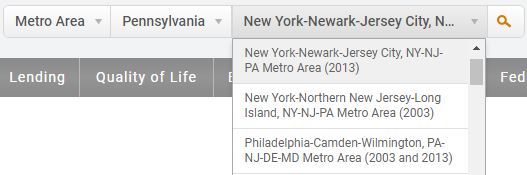
- &state=XX, or &state=XX&county=XX, &state=XX&city=XX, or &state=XX&cbsa=XX – Allows any widget that does not have a default geography to center to a state, cbsa, county, or city. For states, enter the two (2) digit state abbreviation. For geographies that have more than one word, simply use a dash (-) to separate the words.– If a CBSA crosses state lines, you must use the state that leads in the Metro menu on the Set Location bar in PolicyMap.– For CBSAs with multiple counties, the order must match what is displayed in the Metro menu and each county name can be separated by a dash (-). In the example below, it should read; “&state=PA&cbsa=philadelphia-camden-wilmington”
- &etitle=true – shows the data layer title for embedded maps (does not work for widgets)
- &elegend=true – shows the legend for embedded maps (does not work for widgets)
Add these options with a value to the URL will further customize the widget
- &nb=value – Values from 2 to 8 are accepted. This sets the number of breaks used for the thematic data.
- &rmp=color ramp – Changes the thematic colors. When this parameter isn’t set it uses the default purple colors. The available color ramps are: red, blue, orange, green, olive and black.
- &eh=value – The height of the map in pixels, cannot be in percentages (Note: the “&eh” should be less than the “height=” outside the URL).
- &ew=value – The width of the map in pixels, cannot be in percentages (Note: the “&ew” should be less than the “width=” outside the URL).
Using some of the above suggestions, users can make the unemployment widget look like so:
<div style="text-align: center;"><iframe src="https://www.policymap.com/embedmap_dyn?lqid=497350&state=WA&nb=6&nomenus=true&rmp=olive" name="PolicyMap" width="100%" height="600px" frameborder="0" marginwidth="0" marginheight="0" scrolling="no"></iframe></div>
If you have questions about the widgets or want to learn more, please contact Phil Vu phil.vu@policymap.com or 215-574-5896).