
Maximize Justice40 Investments: Overlay CEJST Data with PolicyMap for Targeted Impact

Data
Climate and Economic Justice Screening Tool (CEJST)
Source
Council on Environmental Quality
Find on PolicyMap
- Federal Guidelines
- Climate and Economic Justice Screening Tool (CEJST)
When it comes to energy and climate change, the Inflation Reduction Act (IRA) sets forth a series of incentives and direct investments for projects designed to reduce carbon emissions, increase energy innovation, and support underserved communities. A number of these incentives are designed to support clean energy investments in very specific low-income communities around the country. PolicyMap can help make the identification and targeting of these places simpler and more impactful.
In addition to the IRA-related tax incentive areas which we made available in PolicyMap and discussed in a post late last year, we’ve now added new indicators from the Council on Environmental Quality’s Climate and Economic Justice Screening Tool (CEJST) that identify disadvantaged communities. CEJST’s overburdened and underserved census tracts are pivotal markers, pinpointing communities that face significant disadvantages. Their inclusion in PolicyMap is essential as organizations must ensure that 40% of investments directly benefit these identified communities.
What is the Justice40 Initiative?
Disadvantaged communities identified by CEJST face burdens across eight categories: climate change, energy, health, housing, legacy pollution, transportation, water and wastewater, and workforce development.
Under the Justice40 Initiative, introduced by the Biden Administration, at least 40% of certain Federal investments, including many of those carried out through the IRA, must directly benefit these disadvantaged communities. This requirement covers federal investments from clean energy infrastructure, to affordable and sustainable housing and remediation of legacy pollution. The Justice40 Initiative is designed to ensure that this funding is simultaneously used to redress historical injustices, prioritize equity, and ensure that communities disproportionately affected by environmental degradation and economic hardship are at the forefront of receiving resources to thrive.
Locating Disadvantaged Communities with CEJST
The indicators currently available in PolicyMap include the overall disadvantaged community status1 and the disadvantaged status for the eight different categories of burden. Having these available in PolicyMap allows organizations to target investments based on multiple criteria, including the Justice40 criteria.
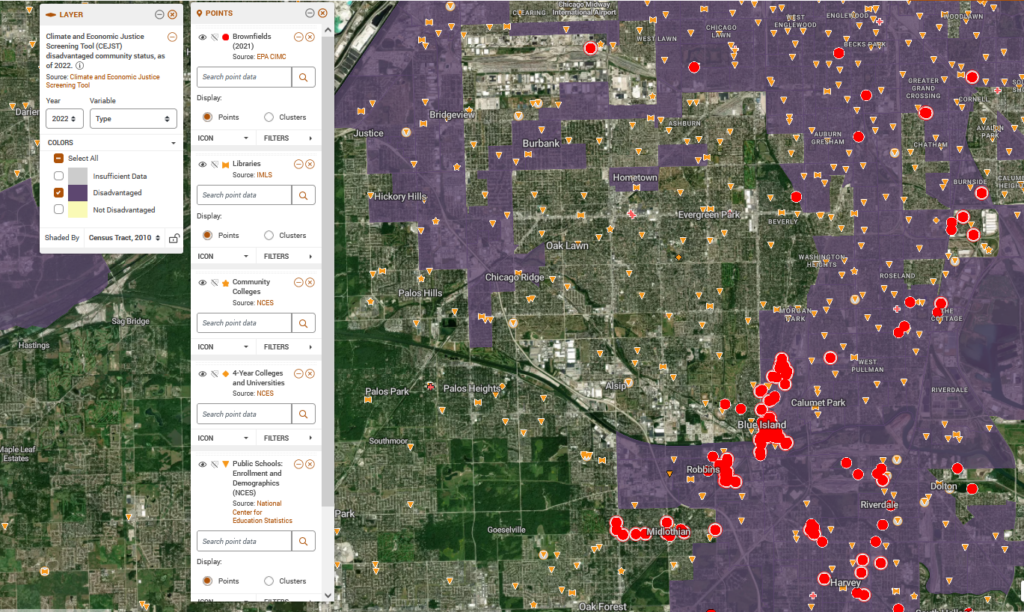
With PolicyMap, an organization can consider prioritizing clean energy investments in disadvantaged communities that are home to both brownfield sites and significant public institutions such as schools, colleges, hospitals, and public libraries. For example, the area below in Cook County, outside of Chicago, shows disadvantaged areas in purple with brownfield sites as red dots and public institutions as orange icons. Visualizing all of this information in one place can help organizations more easily craft strategic and impactful clean energy investment strategies.
Coming Soon: More CEJST Indicators!
Are you interested in maximizing your organization’s Justice40 investments? Get in touch.
And don’t miss out! Additional underlying indicators from CEJST will be available in PolicyMap later this year. Fill in the form to receive updates on the launch of additional indicators.
Footnotes
- Census tracts are considered disadvantaged if they meet the thresholds for at least one of the CEJST categories of burden OR if they are on land within the boundaries of Federally Recognized Tribes. Meeting one of the CEJST categories of burden requires that a tract be at or above specified thresholds for one or more environmental, climate, housing, health, or other burdens AND be at or above the threshold for an associated socioeconomic burden (eg. low income or low educational attainment). Additionally, a census tract that is completely surrounded by disadvantaged communities and is at or above the 50th percentile for low-income is also considered disadvantaged. ↩︎