
Top 10: Falling Home Sales between 2008 to 2009
Update (06/09/2021): PolicyMap now has home sale data from Moody’s Analytics. Read more here.
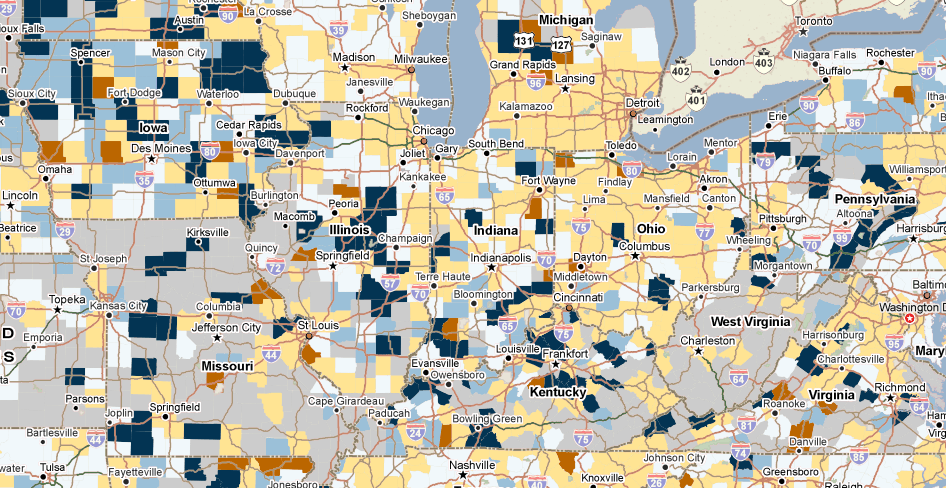
In a recent article, the New York Times reported this week that home sales have fallen to their lowest level in more than a decade. What places are being most affected by declining sales rates? PolicyMap has the answer, with our Boxwood Means home sale data, which is available down to the block group level.
Counties with the highest change in the number of residential homes sold between 2008 and 2009
| County, State | Percentage Change | |
|---|---|---|
| Montgomery, IL | -96.76% | |
| Beaufort, NC | -95.12% | |
| Franklin, IA | -94.92% | |
| Seneca, OH | -94.55% | |
| Hardin, OH | -93.60% | |
| Columbia, AR | -89.84% | |
| Black Hawk, IA | -89.39% | |
| Van Buren, AR | -89.21% | |
| Izard, AR | -88.46% |
The map and table above represents percent change in number of residential homes sold from 2008 to 2009. Data is from Boxwood Means, who does not account for inflation in this calculation. TRF has suppressed data in places with fewer than five sales in either year. Grey areas on the map show places where data is unavailable, incomplete, or suppressed. Data might be unavailable for several reasons, including the county not having a current data collection contract with the collection agency that supplies data to Boxwood Means, Inc., and there being no sales reported in a given place (in the instance of a non-residential tract, for example). For more on the accuracy of locating these sales on a map, and the extent of Boxwood Means, Inc.’s coverage, see Home Sale Data in the Data Directory.
Do you want to learn more about this dataset or other features on PolicyMap? Join our free weekly trainings (Click Here) or send your questions to pmap@policymap.com.
![]()