
Track Housing Trends with New PolicyMap Data Made Possible by Zillow

Data
Home Sale Data
Source
Find on PolicyMap
- Housing
- Home Sales
- Sales and Sale Price
- Home Sales
Update (06/09/2021): PolicyMap now has home sale data from Moody’s Analytics. Read more here.
“The dream of homeownership remains very much alive.”1
“Homeownership can be bad for wealth accumulation.”2
“Homeownership has been linked to positive health outcomes.”3
Regardless of whether you believe the American dream of homeownership is the golden ticket for advancement, wealth building, and good health, residential real estate trends matter to the vast majority of Americans. These trends affect issues ranging from affordability and availability of housing, to gentrification, displacement, and housing stability.
Knowing how many homes have sold, what prices they are selling for, and how this has changed in recent years is key to understanding the local housing market. How much housing is affordable to current residents, how much turnover is occurring, and how much equity residents have built up in their homes affect the fabric of a neighborhood and influence how its character might be changing.
Because this kind of information is so useful, we’re pleased to announce our new home sale data, developed by the PolicyMap data team using data from Zillow’s ZTRAX database. There’s a lot to be excited about with this new data.
What’s Included
This new set of home sale indicators includes number of home sales, median home sale value, and percent change (over one quarter, and one, three, or five years) values with annual and quarterly data going back to 2005 (and up to the latest available, currently 2018 quarter 2) with detail down to the block group (for annual data, census tract for quarterly data).
Using Our New Home Sale Data
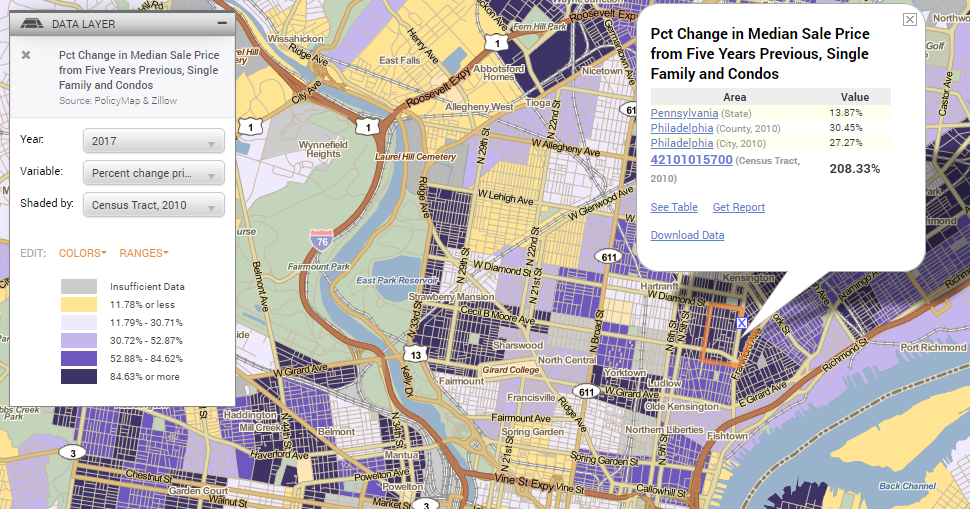
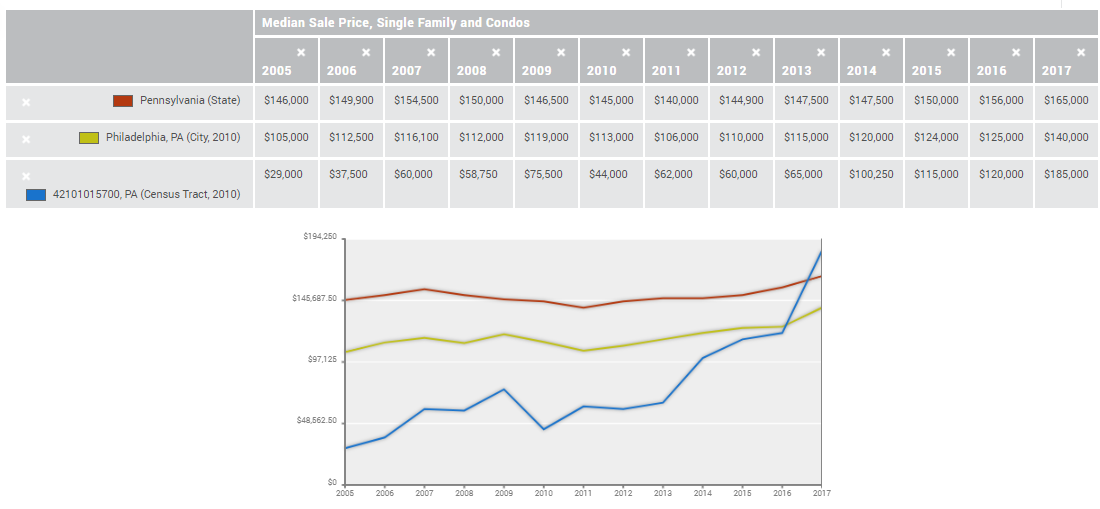
With historic data extending to 2005, it’s easy to assess rapidly changing neighborhoods like this one in Philadelphia, both on the map and by looking at graphed change in sales prices.
Very soon, we’ll also have data available breaking out home sales by single family, multifamily, and condominium/cooperative housing units. This will give a more nuanced sense of the housing market in a city or neighborhood, revealing specific types of housing market shifts in densely populated urban areas.
This data is in the “Housing” menu, under “Home Sales”. It is available to PolicyMap subscribers and enterprise license users (more information on subscriptions can be found here).
For any questions about our methodology for the aggregations of Zillow’s ZTRAX data, please see our Data Directory page.
1Belsky, Eric “The Dream Lives On: the Future of Homeownership in America”
2Emmons, William “Is Homeownership Bad for Wealth Accumulation?”